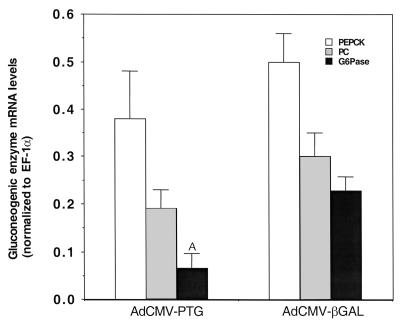
Figure 8.
Effect of PTG on gluconeogenic enzyme expression. Levels of PEPCK, PC, and G6Pase mRNA were measured by multiplex PCR in liver samples from 4 PTG high expressers and 4 AdCMV-βGAL infused controls (a subset of the samples used in Figure 5). Data were normalized to EF-1α as the internal control. G6Pase expression was reduced by 70% in PTG high expressers compared with AdCMV-βGAL controls (*P = 0.01), whereas expression of PEPCK and PC did not change significantly.

