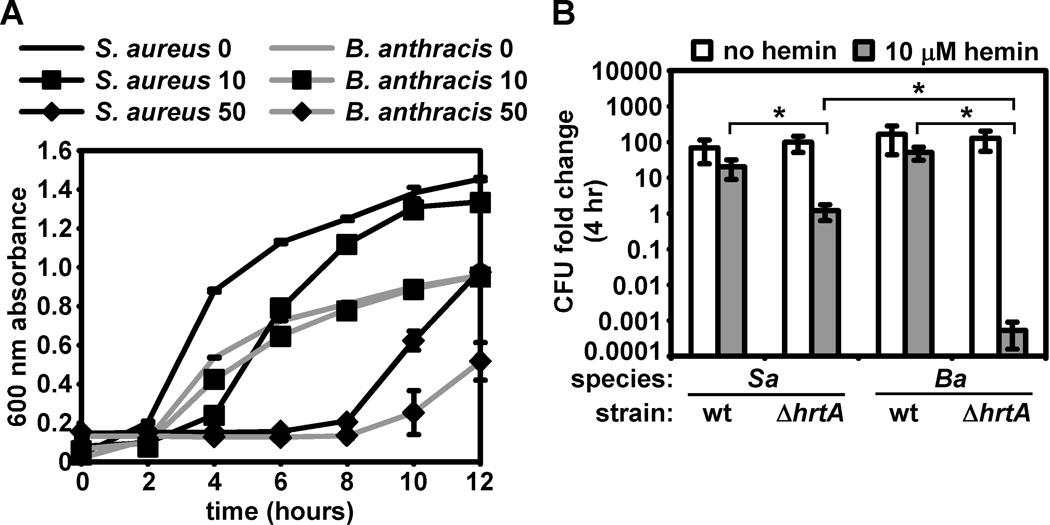
Figure 7. Differential hemin sensitivity of S. aureus and B. anthracis ΔhrtA.
A. Proliferation of wildtype S. aureus and B. anthracis in hemin. Growth curve analysis was performed on S. aureus (black lines) and B. anthracis (grey lines) grown in BHI without hemin (no symbols), BHI + 10 µM hemin (a hemin concentration that inhibits hss/hrt mutants; boxes), or BHI + 50 µM hemin (a hemin concentration that inhibits wt S. aureus and B. anthracis; diamonds). B. Resistance of wildtype and ΔhrtA S. aureus and B. anthracis to hemin. S. aureus (Sa) and B. anthracis (Ba) wildtype (wt) and ΔhrtA were grown overnight and subcultured into BHI or BHI + 10 µM hemin. At the time of subculture and after a four-hour incubation, serial dilutions were performed and plated and colony forming units (CFU) were enumerated. Data is presented as the fold change in CFU following incubation in the presence or absence of hemin (log scale). Asterisks denote statistically significant differences by Student’s t-test (p < 0.05). All results are representative of triplicate independent experiments. Error bars correspond to one standard deviation from the mean of triplicate samples within the same experiment; asterisks denote statistically significant differences by Student’s t test (p<0.05).

