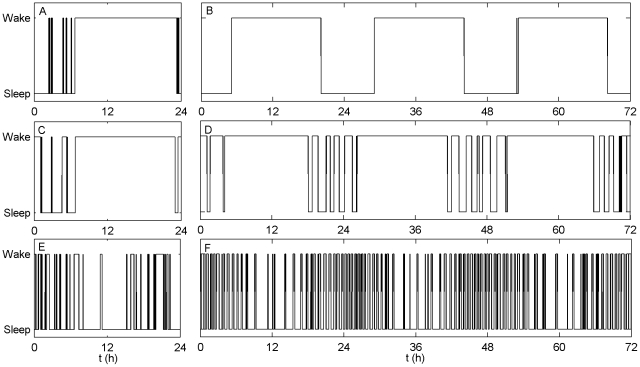
Figure 3. Comparison of experimental data to model output.
Time series for wake vs. sleep state are shown for three species, comparing the model to experimental data. Human: (A) data from [32], (B) model ( ,
,  h). Elephant: (C) data from [22], (D) model (
 ,
,  h). Opossum: (E) data from [27], (F) model (
 ,
,  h). Noise is added to the model to make sleep patterns less regular (see Methods for numerical details).

