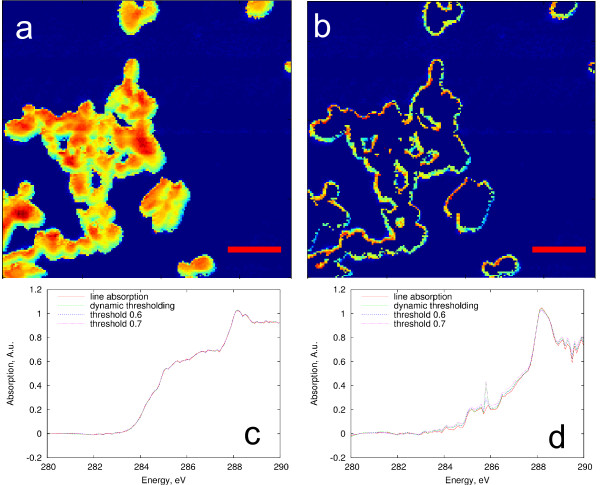
Figure 3.
Spectral processing performed by STXMPy. (a, b) Pseudocolored reference images generated by EvalSm.py (scale bar = 2 μm). A field of melanosomes as they appear from the sum of energies 283 eV - 289 eV (a) or following automated selection of regions of interest (ROI, panel b). The edge of the ROI discarded because of higher spectral noise is evident. (c, d) Mean values of individual stacks showing influence of intensity threshold on absorption spectra from data with consistent beam intensity (c) or broad intensity fluctuations (d).

