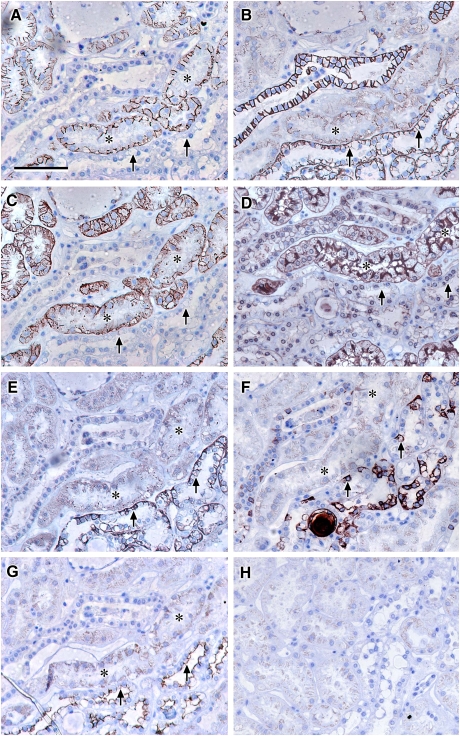
Fig. 2.
Localization of claudin-2, -10 and -11: photomicrographs showing serial sections of human renal cortical tissue stained for N-cadherin (A), E-cadherin (B), claudin-2 (C), L. tetragonolobus (D), claudin-10 (E), D. biflorus (F) and claudin-11 (G); representative negative control (H) [N-cadherin and claudin-2 stained strongly positive in L. tetragonolobus positive proximal tubules which showed faint discrete junctional staining for claudin-10 and E-cadherin, faint cytoplasmic staining for claudin-11 and negative for D. biflorus (asterisks, A–G); in addition, strongly positive claudin-10 and -11 staining coincided with strong E-cadherin staining in tubules with a subpopulation of cells intensely stained with D. biflorus suggestive of TAL (arrows); scale bar 100 µm].

