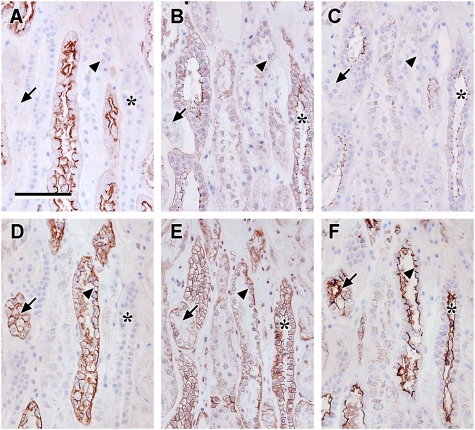
Fig. 5.
Localization of claudin-3, -4 and -8 compared to THP: photomicrographs showing serial sections of human renal cortical tissue stained for L. tetragonolobus (A), claudin-8 (B), claudin-4 (C), THP (D), claudin-3 (E) and EMA (F) [claudin-8, -4 and -3 stained tubules that were coincident with similar ones that were positive for EMA and negative for L. tetragonolobus (asterisks in A–C, E and F), confirming the expression of these claudins in the distal nephron (TAL or DCT) or collecting duct; THP staining was coincident with a subpopulation of EMA positive tubules that was positive for claudin-3 and not claudin-4 or -8 or L. tetragonolobus, indicating that claudin-3 is expressed in the TAL (arrows and arrowheads in A–F); scale bar 100 µm].

