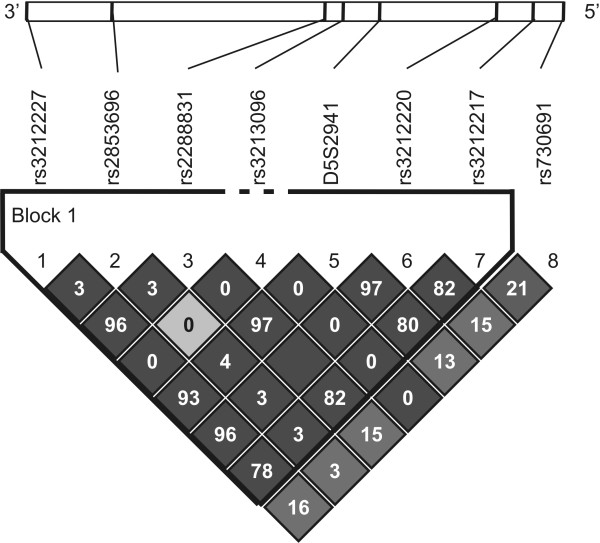
Figure 1.
Plot of LD between IL12B markers analysed in control individuals of the SAC population. Generated by Haploview v4.1. The 5' and 3' ends of the genes are indicated and r2 values (%) are shown on the squares (no value = 100%). The colours of the squares represent D' values, with dark grey being D' = 1, and white D' = 0.

