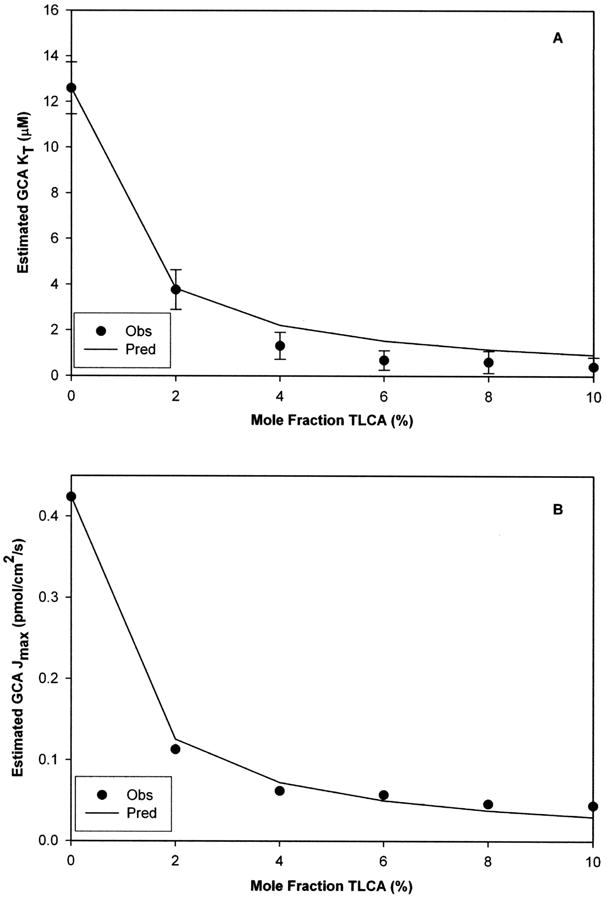
Figure 5. Impact of taurolithocholate on glycocholate kinetic estimates from uptake studies.

Mole fraction of TLCA was varied from 0 to 10%. TLCA contamination produced negative bias on GCA kinetic estimates (i.e. increased “apparent” affinity and decreased “apparent” capacity in panels A and B, respectively). A 2% mole fraction of TLCA generated approximately 70% error on the estimation of both GCA Kt and Jmax. These experimental observations followed the model predicted trends. Unbiased Kt and Jmax of substrate were 12.6 (±1.1) μM and 0.424 (±0.041) pmol/cm2/s, while TLCA Ki was 0.11 (±0.01) μM. Data are presented as mean (±S.E.M.). (S.E.M. bars smaller than symbol in panel B).
