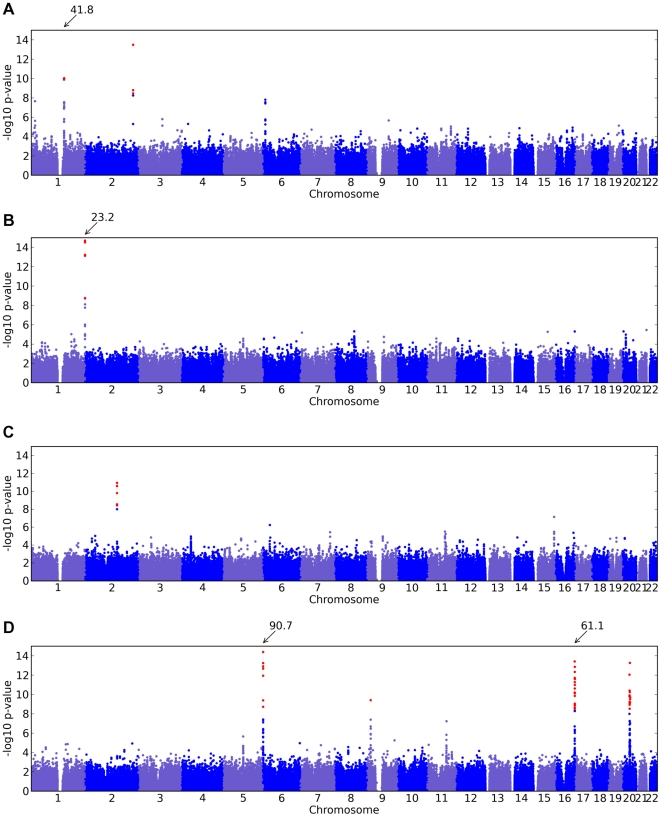
Figure 2. Manhattan plots for new associations.
Shown are (A) hair curl, (B) asparagus anosmia, (C) photic sneeze reflex, and (D) freckling. Plots show scores ( p-values) for all SNPs by physical position. All plots are trimmed at a maximum score of 15. For regions with a more significant association, the strongest score in that region is shown above the region.

