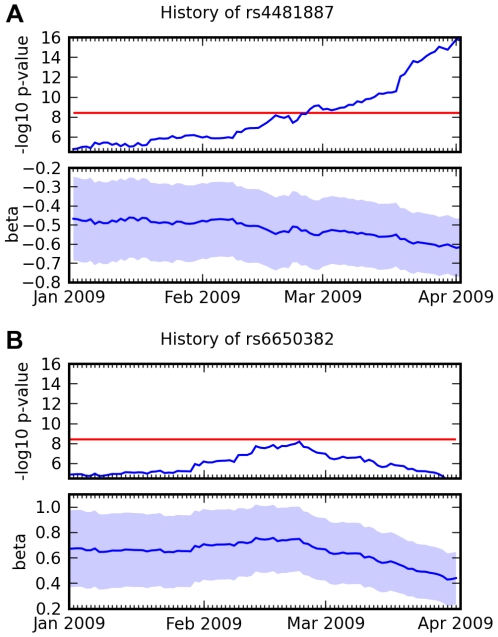
Figure 11. Association over time for two SNPs and two traits.
(A) Association between rs4481887 and asparagus anosmia, steadily increasing in certainty. (B) Association between rs6650382 and photic sneeze: a very promising initial result, but  , the log odds ratio, regressed towards 0. Both traits were assessed in the same survey, so they had approximately the same number of responses at all points in time. Scores (
 p-values) and regression coefficients are plotted using the genotype and phenotype data that was available at various points in time. The red line indicates our significance threshold of 8.4.

