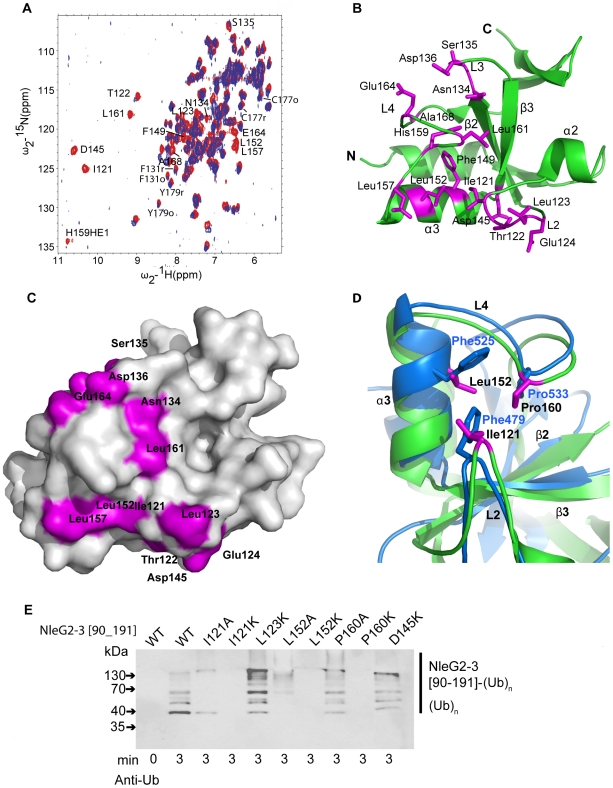
Figure 6. Detailed analysis of NleG interactions with UBE2D2.
(A) Overlay of the 1N-1H HSQC spectrum of 15N-labeled NleG2-3[90–191] recorded at 25°C in the absence (red) and in the presence (lilac) of unlabeled UBE2D2 at a 1:1 protein ratio. The resonances of NleG2-3 residues significantly affected by UBE2D2 are labeled. (B) Ribbon diagram of the structure of reduced NleG2-3[90–191] (green) with residues whose NH resonances were severely line-broadened in 1N-1H HSQC spectra upon addition of UBE2D2 coloured purple. (C) Surface representation of (B). (D). Superimposition of AvrPtoB (PDB 2FD4, contact residues and backbone in bleu) and reduced NleG2-3[90–191] (predicted contact residues, purple and backbone, green), with both structures shown by ribbon diagrams, with selected secondary structure elements of NleG2-3[90–191] and selected residues from both structures labelled. (E) Immunoblot analysis using anti-ubiquitin antibodies of reactions performed in the presence of ATP, ubiquitin, E1, UBE2D2 and NleG2-3[90–191] variants. The NleG2-3 variants include the wild type (WT) fragments NleG2-3[55–191] and I121A, I121IK, L123K, L152A, L152K, P160A, P160K, E164K and D145K mutants.

