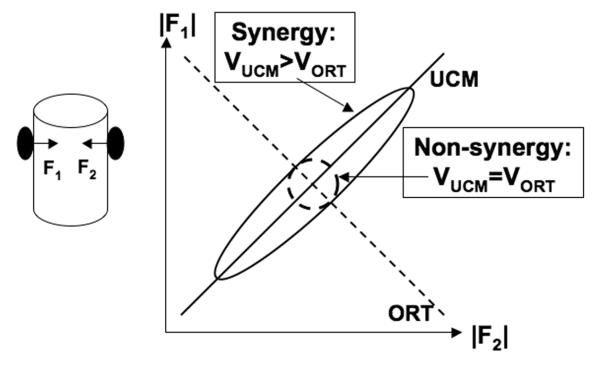
Fig. 1.
An illustration of force variability in a two-digit precision grip (see the left panel). The ellipses represent data distributions across a large number of trials. The solid slanted line (the uncontrolled manifold, UCM) corresponds to F1 + F2 = 0, while the dashed line (ORT) corresponds to a change in the resultant force (FRES). If most digit force variance is within the UCM (an ellipse elongated along the solid slanted line, VUCM > VORT), this by definition corresponds to a two-digit synergy stabilizing FRES. A circular data distribution corresponds to a non-synergy with respect to FRES.

