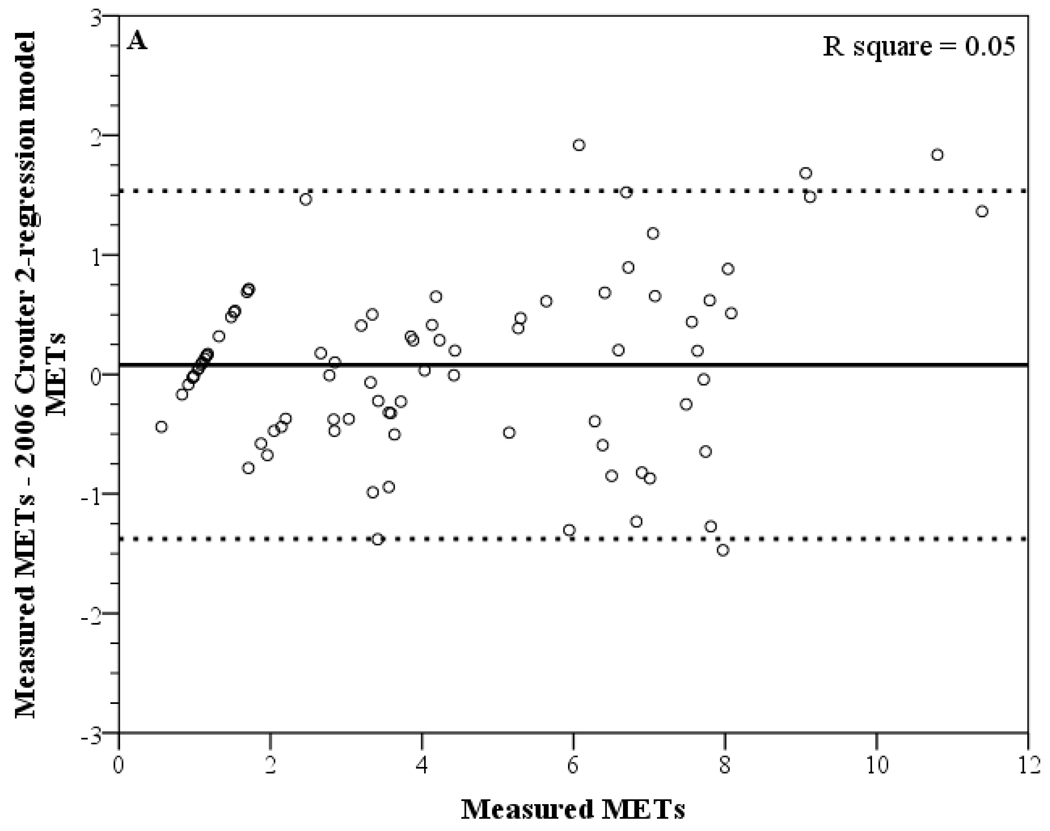
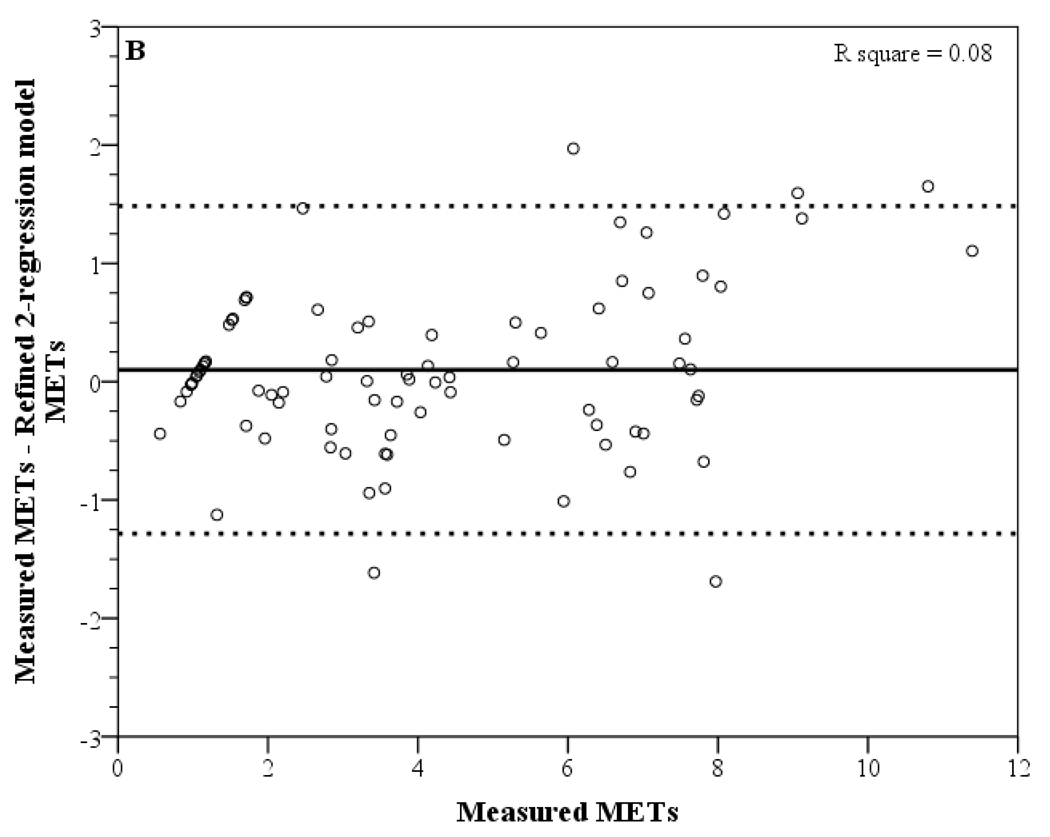
Figure 1.
Bland-Altman plots depicting error scores (actual minus estimation) for (A) the 2006 Crouter 2-regression model and (B) the refined 2-regression model. Solid line represents the mean and dashed lines represent the 95% prediction interval of the observations. Cycling is not included in these graphs.


