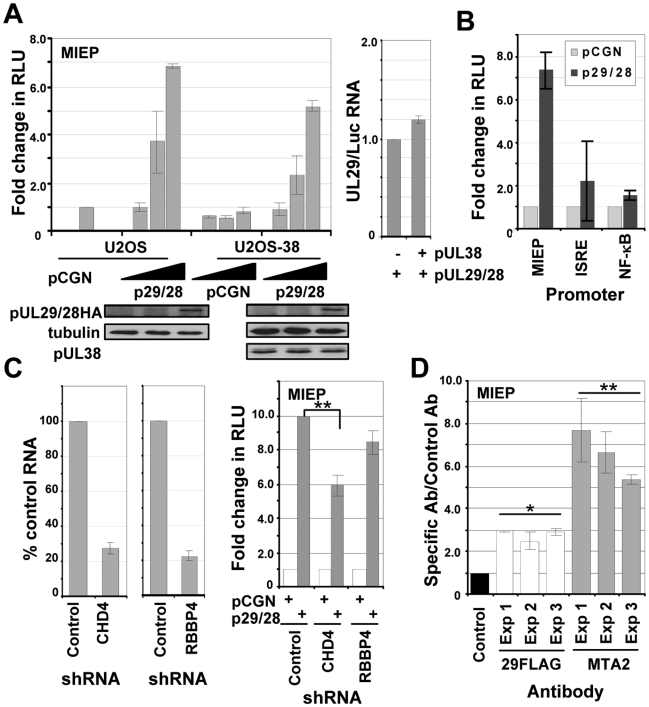
Figure 8. pUL29/28 specifically activates the MIE promoter irrespective of HCMV pUL38 expression.
(A) pUL29/28 activates the MIEP. Upper left panel: U2OS cells that stably maintained the empty pLXSN vector (U2OS) or pLXSN expressing HCMV pUL38 (USOS-38) were transfected with 50 ng of pGL3-MIEP reporter plasmid and 10, 100, or 500 ng of pCGN empty vector or pCGN-pUL29/28 effector plasmid. Luciferase activity was assayed 48 h posttransfection using equal protein amounts within each lysate and normalized to luciferase activity from empty vector. Lower panels: The levels of pUL29/28HA and pUL38 expression were assayed by Western blot analysis using the same lysates and antibody to HA, pUL38 or tubulin. Right panel: UL29 and luciferase RNA expression was determined by qRT-PCR from U2OS as compared to U2OS-38 cells. (B) pUL29/28 exhibits promoter-specific effects. Luciferase assays were completed using 500 ng of pCGN or pCGN-pUL29/28 and MIEP, ISRE and NF-κB promoter reporter constructs. The relative luciferase activity was determined as described above. (C) NuRD is required for optimal expression of an MIEP reporter. Left panel: Disruption of the NuRD complex in U-2 OS cells. Short hairpin RNA (shRNA) sequences to a scrambled control, CHD4 or RBBP4 were delivered to U-2 OS cells using lentiviruses and expressing cells were isolated by puromycin resistance. Expression of CHD4 and RBBP4 was quantified by qRT-PCR. The data was normalized to GAPDH RNA levels and includes the percent reduction for each gene relative to control. Right panel: Luciferase assays were completed using either empty pCGN or pCGN-pUL29/28 and MIEP reporter. The relative luciferase activity was determined as described above and the data is derived from replicate experiments (**p<0.03). (D) pUL29/28 and MTA2 interact with the MIE promoter during infection. Cells were infected using BADinUL29F at a multiplicity of 3 pfu/cell and harvested at 48 hpi. Antibodies to the FLAG epitope in pUL29/28FLAG, cellular MTA2 and a control antibody to HCMV pUS24 were used to immunoprecipitate chromatin-DNA complexes, and isolated DNA was quantified by qPCR and primers to the HCMV MIE promoter. The results are plotted as the ratio of viral DNA immunoprecipitated to input DNA for each antibody relative to that of the control antibody. The data present the average of two separate qPCR quantifications from three separate experiments. Significance of changes for the pooled sets of samples from three experiments were analyzed by student's t-test, and the p value is indicated by an asterisk (*p<0.007,**p<0.03).

