Figure 4.

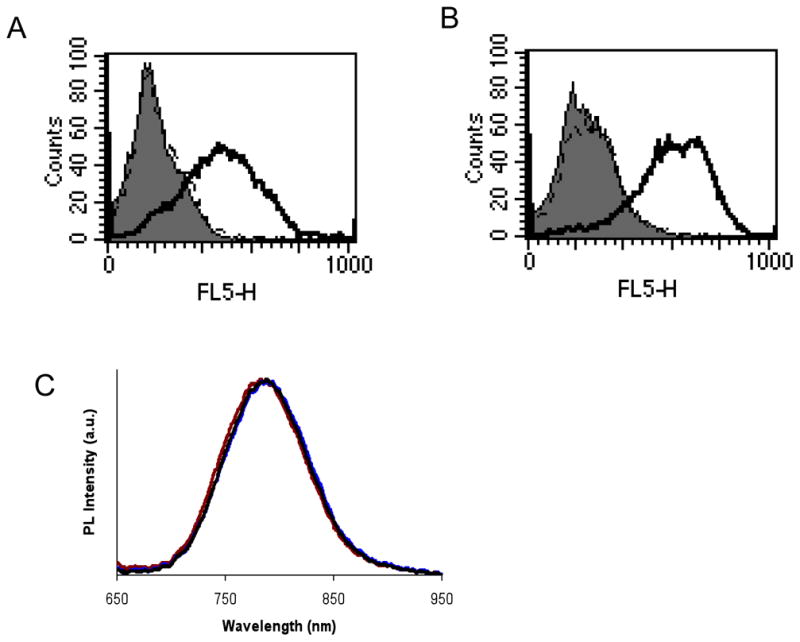
(A) Flow cytometry analysis of cys-diabody conjugated NIR Qdot binding with MCF7/HER2 Cells. Cells were treated with no protein (solid grey), mock conjugated Qdot 800 (dotted black line) and anti-HER2 iQdot 800 (solid black line). (B) LNCaP/PSCA cells stained with no protein (solid grey), mock conjugated Qdot 800 (dotted black line) and anti-PSCA iQdot 800 (solid black line). FL5 (λem: 740 long pass) was the filter used for Qdot 800. (C) Normalized emission spectra of amino PEG Qdot 800 conjugates. Excitation wavelength was 532 nm. Corresponding emission peaks and associated full-width half-maximum values were 787.9 and 88.95, 785.7 and 89.19, and 789.0 and 89.62 nm for mock conjugated Qdot 655 (black line), anti-HER2 iQdot 800 (red line) and anti-PSCA iQdot 800 (brown line) respectively.
