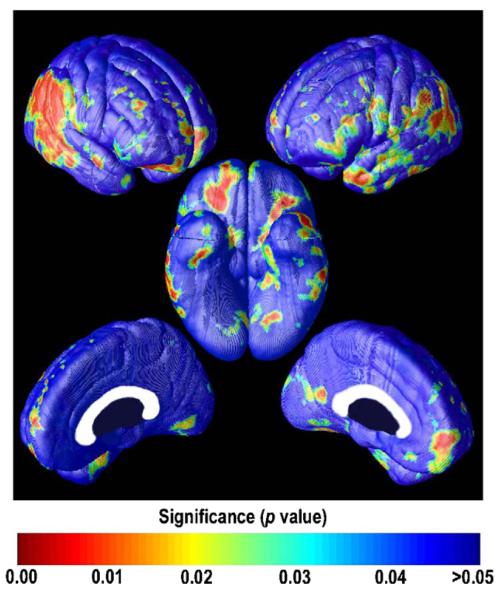
Fig. 1.
Increasing [18F]FDDNP and declining cognition. Cortical maps show that as [18F]FDDNP signal (DVR) increased at each cortical surface point (across all subjects), cognitive performance decreased (see Section 2 for calculation of composite test scores). Regions of significant correlation (p < 0.05), color-coded in red, follow the profile of tangle and plaque accumulation characteristic of mild AD, as established in large-scale post mortem mapping studies (Braak and Braak, 1991). Corresponding maps did not show regions where both [18F]FDDNP signal and cognition increased together (not shown here; maps are blue with p > 0.05 at all voxels). (For interpretation of the references to color in this figure legend, the reader is referred to the web version of the article.)

