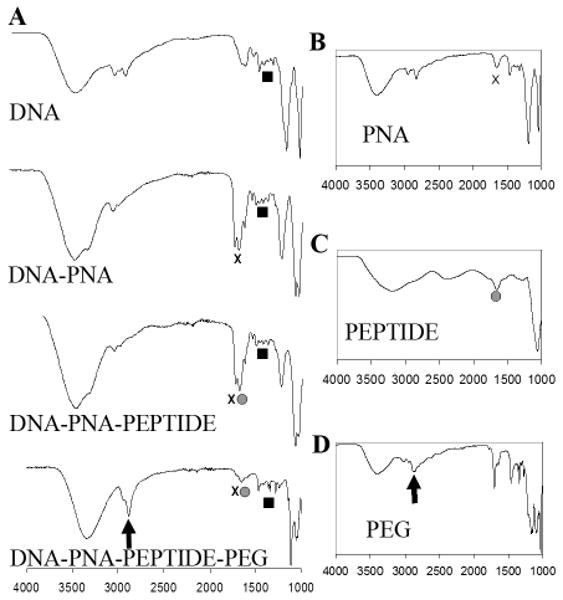
Figure 3.

ATR-FTIR Characterization of the DP3 Conjugates. (A) ATR-FTIR spectra of the GWiz plasmid (top), the DP3 conjugate (bottom), and conjugates lacking one or more conjugate components (middle). The main absorption bands of DNA (black squares) are: 1063 cm-1 (symmetric stretching vibration of the phosphate groups), 1222 cm-1 (antisymmetric stretching vibration of the phosphate group), 1017 cm-1 (vibration of C=N of ribose), and 1693 cm-1 (vibrations of C6=O of guanine and C4=O of thymine). Amide bonds, found in both PNA (B) and peptide (C), have an expected peak at approximately 1630 cm-1 (black “x”s in [A] and [B] and grey circles in [A] and [C]). Peaks attributable to PEG (D) are observed at 2890 cm-1 (black arrows in [A] and [D]), indicative of the –CH2- stretching vibrations.
