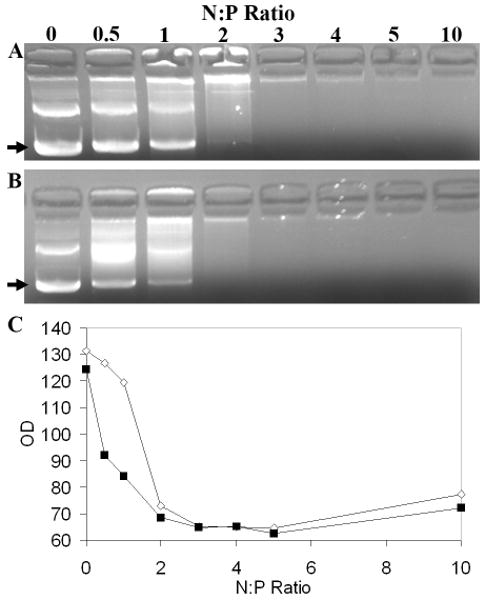
Figure 7.

Assessment of Complexation Efficiency by Ethidium Bromide Exclusion Assays. PEI-DNA (A) and PEI-DP3 (B) polyplexes were prepared and analyzed by agarose gel electrophoresis at N:P ratios ranging from 0 to 10. The bands corresponding to supercoiled plasmid DNA are indicated (arrows). (C) Optical density measurements of the supercoiled DNA band for PEI-DP3 (black boxes) and PEI-DNA (white diamonds) polyplexes for the gel shown in A. The trends in optical density were consistent in replicates of the same experiment. Other bands on the gel include open circular and nicked plasmid DNA, as well as DNA aggregates found in the wells of the gel.
