
Figure 8.
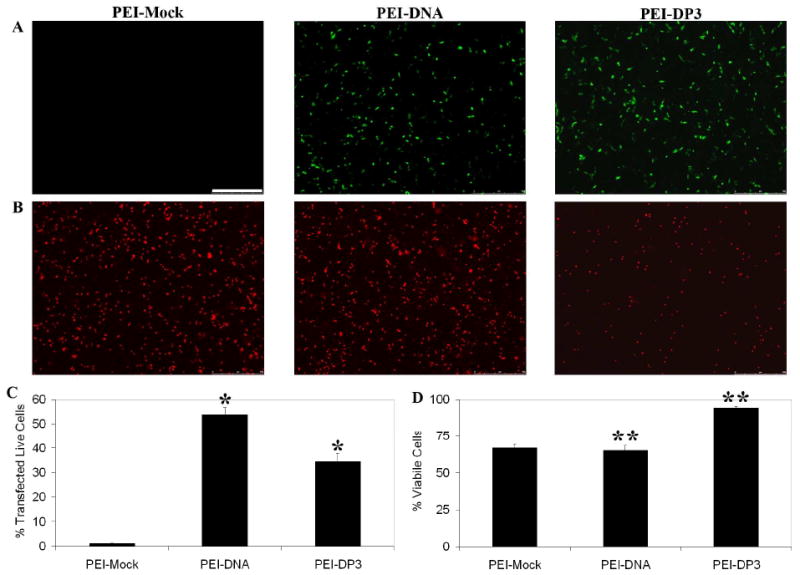
Transfection Efficiency and Cytotoxicity Assays. The transfection efficiencies of PEI-Mock (complexes made with PEI and a non-GFP-expressing plasmid), PEI-DNA, and PEI-DP3 complexes formulated at N:P = 10 were assessed in CHO cells 24 h post-transfection by fluorescence microscopy (A) and flow cytometry (C) to detect GFP fluorescence. The scale bar (shown in [A]) = 500 μm. The data in (C) represent the mean values obtained from three separate transfection experiments, and the error bars represent one standard deviation from the mean. Statistically significant differences were observed between the indicated samples (p [*] = 0.038). (B) The cytotoxicities of the same complexes were evaluated with a ethidium homodimer stain and fluorescence microscopy (B). Quantification was performed by image analysis (D), and [**] indicate a statistically significant difference between the indicated samples (p [**] = 0.0001).