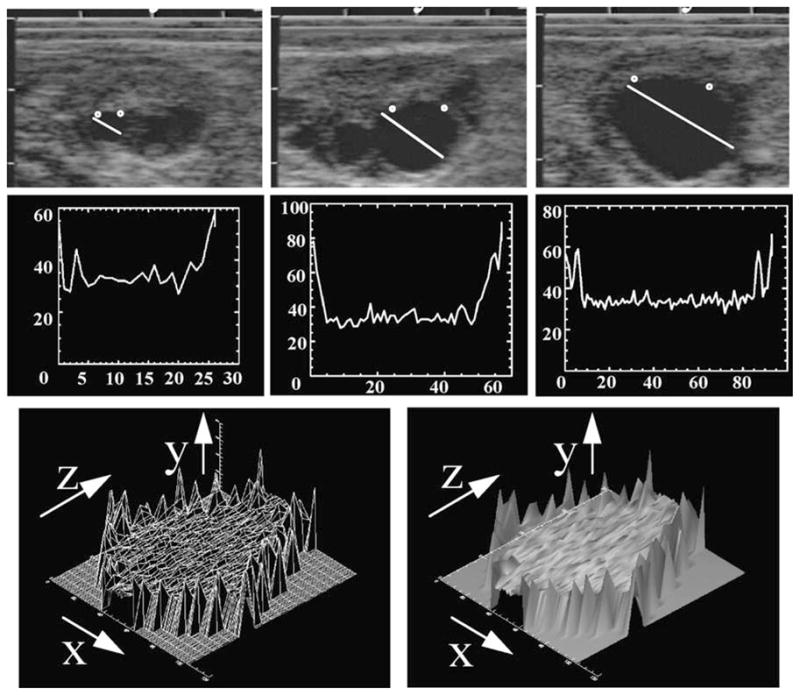
Fig. 6.

Time-series analysis of a dominant anovulatory follicle. Individual follicles are identified (top three panels) on a daily basis and a graphic line representing their numerical values created (second three panels). The numerical values are concatenated and a wire-mesh framework created (lower left panel). The X dimension represents the diameter of the follicle including the follicle wall, the Y dimension represents the numerical pixel value, and the Z dimension represents the days of the cycle on which the follicle was uniquely identified. A surface rendering (skin) is placed over the framework to yield a conceptualization of the physiologic status of the follicle (lower right panel) from the time that the follicle was first identified, completes its growth phase, enters and passes through a static phase, and then regressed until it could no longer be identified. Addition of color shading algorithms adds to greatly enhanced visual perception.
