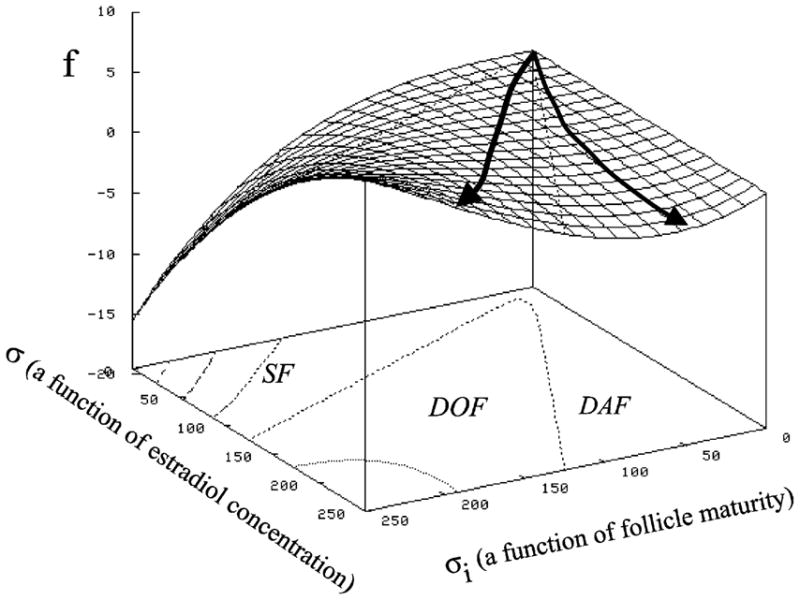
Fig. 7.

Three dimensional parametric space model of ovarian follicular development. Maturity, m, of the follicles was equated to diameter. The rate of growth of the follicle z was determined by using central finite differences from the ultrasonographic time series data. The maturation rate (pg E2 per hour calculated based on daily blood samples, ξ reflects circulating E2 and ξi reflects maturity. SF represents the spatial area of subordinant follicles, DOF that occupied by dominant ovulatory follicles and DAF the area associated with dominant anovulatory follicles. The data were then plotted in the three dimensional (z, m, E2) parametric space and interpolated to yield a mathematical maturation surface. We are interested in modifying this model to include image attributes, like echotexture and follicle size, and the effects of pathology and pharmacologic intervention which will yield interpretive models. On the surface framework, the line to the left illustrates the developmental history of a dominant ovulatory follicle while the line to the right illustrates the history of an dominant anovulatory follicle (modified from Sarty and Pierson, 1998).
