
Figure 3.
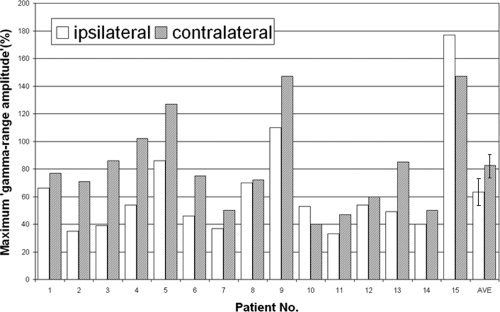
The magnitude of γ‐augmentation elicited in the superior temporal gyrus. The maximum “γ‐range amplitude” (unit: %) in “the center of auditory event‐related γ‐augmentation” is shown by a bar graph. ECoG analysis relative to the onset of motor responses showed that the maximum “γ‐range amplitude” was 82% on average when the hand contralateral to the recorded hemisphere was used for motor responses and 63% on average when the ipsilateral hand was used. AVE, average across the 15 hemispheres (error bars shown).