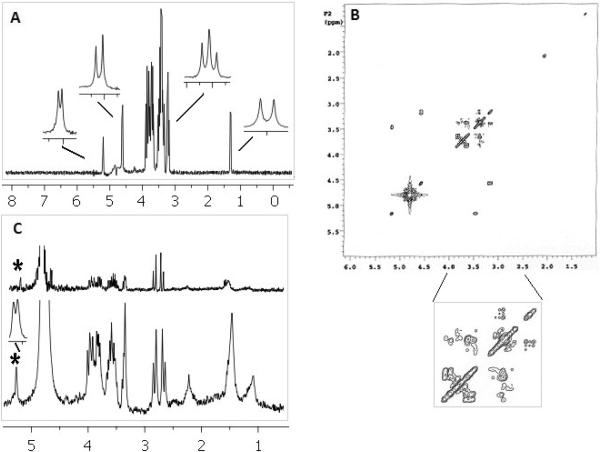
Fig. 4.
High resolution 1D 1H spectrum (A) and 2D COSY (B) of mixture (20 mM) of glucose and threonine acquired in 20-μL coil with ultem plugs. 1D insets show the resolved signature peak chemical shifts (glucose multiplets at 4.6, 5.2, and 3.2 ppm, and threonine doublet at 1.3 ppm). (C) 1D 1H spectrum of deproteinated human plasma with 36 scans in the susceptibility plug containing 20-μL probe (lower) and 5 mm conventional probe (upper). For the same mass of glucose raw SNR was 28.5:1 for a susceptibility plug microcoil probe compared to 3:1 for the 5 mm conventional probe.

