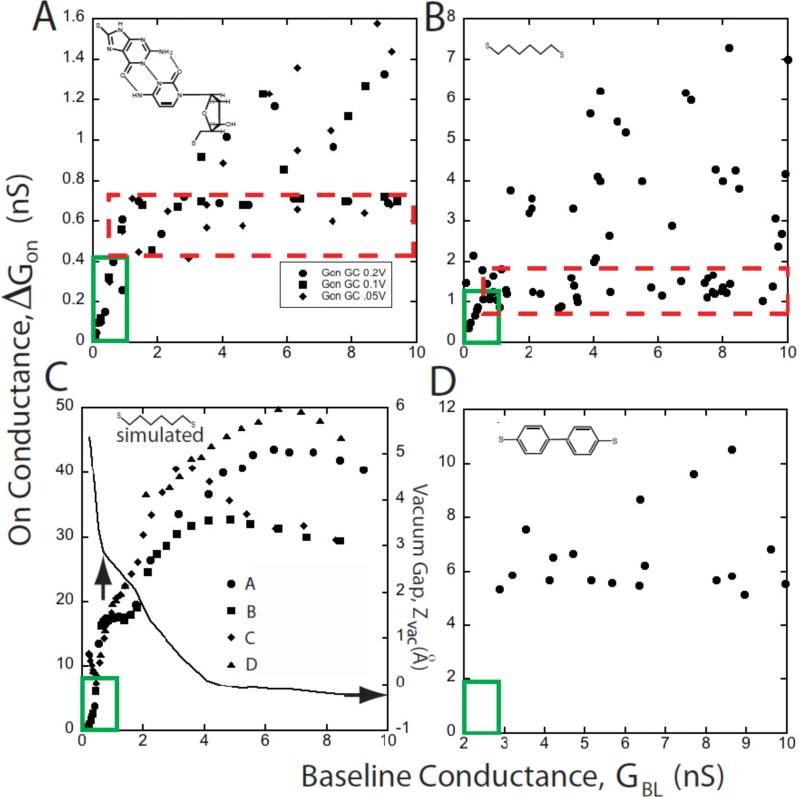
Figure 4.
Interpretation of scatter plots of the molecular conductance (ΔGON) vs. the baseline conductance (GBL). (A) shows typical experimental data for a probe functionalized with a base (guanine) interacting with a surface-bound nucleoside (deoxycytidine). The red dashed box encloses a “plateau” region where the majority of the data are relatively constant. As GBL is increased, the number of large conductance points also increases as do the largest values of ΔGON. At the smallest values of GBL there is a region (solid green box) where ΔGON ∝ GBL and the data are single valued. Data for octanedithol show the same general features (B). Simulations for octanedithiol (C) reproduce these features. This plot was generated for a series of different contact geometries (A-D, illustrated in figure 5). The scatter increases as GBL is increased in a way that closely resembles the experimental data in (B) (though calculated conductances are higher than the measured conductances). The simulations all converge at small GBL, giving rise to a region where data are single valued and ΔGON ∝ GBL, as observed in the experiments. The “plateau region” is less densely occupied in the simulated data, probably because of the limited number of tip geometries explored. In reality, we would expect to find many points around the periphery of the point forming the smallest gap that can accommodate molecules in their equilibrium configuration. The solid line in (C) shows the variation in the gap between the gold atom attached to the sulfur atom and the rest of the gold electrode (Zvac). A nominal contact point (vertical arrow) is defined by the baseline conductance at which the slope of the Zvac curve changes abruptly. This is coincident with the transition from contact-independent conductance to contact dependent conductance. (D) shows data for a dithiol-diphenol. This “stiff” molecule yields no data in the ΔGON ∝ GBL regime, presumably because “stretched” configurations are not energetically possible in this molecule.

