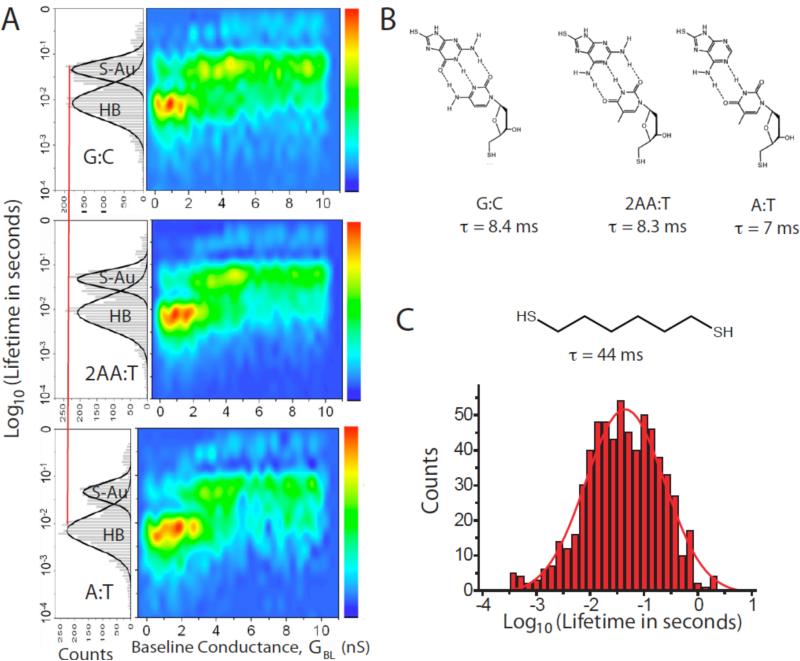
Figure 6.
Lifetime distributions from telegraph noise. (A) shows (left) distributions of the “on” state times for three types of DNA base-pairing (B) in a tunnel gap. Two peaks are observed in the distribution. One is a slower process that coincides with the peak that is observed in junctions with only (S-Au)-Au as the labile bonds (see the data for octane dithiol shown in (C)). The faster process is somewhat dependent on the nature of the hydrogen bonding, and is relatively more important in the A:T junctions (two hydrogen bonds) than the 2AA:T and G:C junctions (three hydrogen bonds). The distributions are broken out as a function of baseline conductance in the color plots to the right. Hydrogen bond-breaking is more important in the large gap (small GBL) regime where the molecule is presumably stretched. (S-Au)-Au breaking dominates in smaller gaps.

