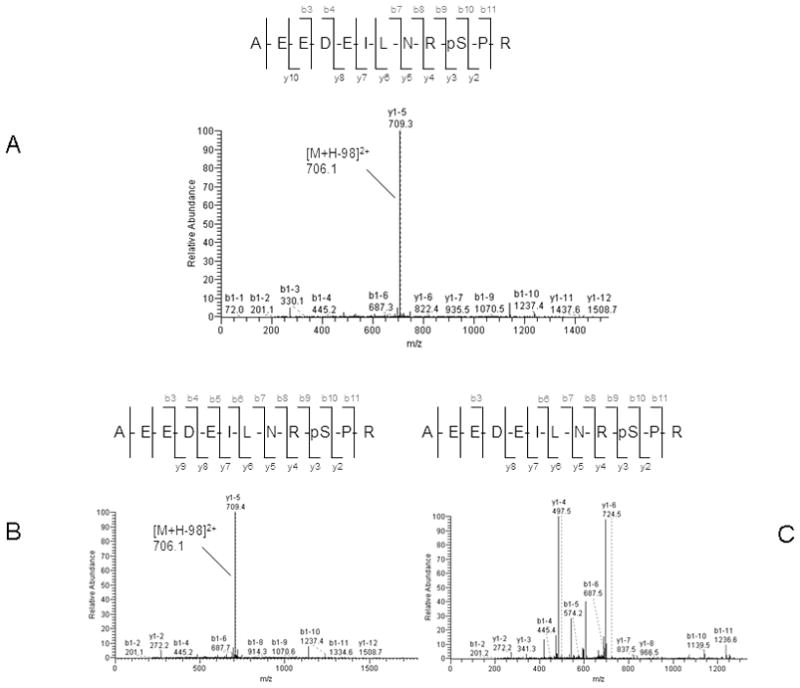
Figure 6.

Representative spectra of singly phosphorylated peptide AEEDEILNRpSPR assigned to protein calnexin (CANX) identified in MS2-only scan (A) and in MS2 + MS3 scan (B and C). A. In the MS2-only scan, the MS/MS spectrum shows that the peak at m/z 706.1 represents the doubly charged form of the selected precursor ion at m/z 754.95 with loss of one H3PO4 group B. In the MS2 + MS3 scan, the MS/MS spectrum show the peak at m/z 706.1 represents the doubly charged form of the selected precursor ion at m/z 754.4 with loss of one H3PO4 group. C. In the MS2 + MS3 scan, the MS/MS/MS spectrum for the fragment ion at m/z 706.1 corresponds to the neutral loss of the H3PO4 group.
