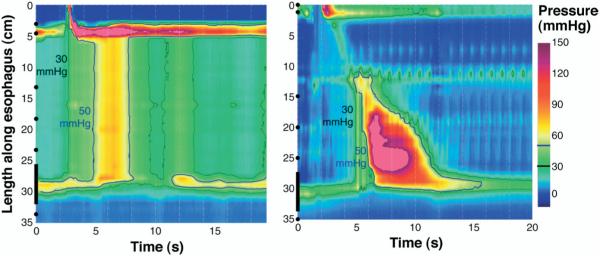
Figure 4.
The distinction between achalasia associated with panesophageal pressurization (left) and vigorous achalasia (right). In each case, the black line indicates the 30-mmHg isobaric pressure contour and the blue line the 50-mmHg isobaric pressure contour. Both examples have grossly impaired EGJ relaxation evident by the integrity of the 30-mmHg isobaric contour along the upper margin of the sphincter domain.

