
Figure 3.
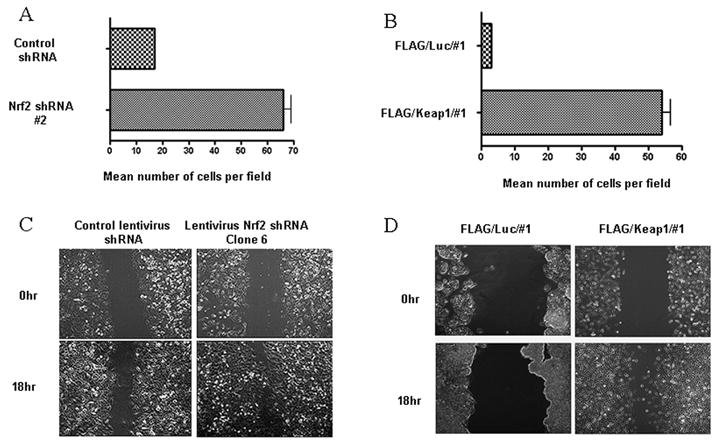
Loss of Nrf2 is accompanied by increased motility. A) & B) Transwell Migration Assay. The histogram illustrate the number of cells that penetrated the membrane 18 hrs after inoculation; C) & D) A scrape assay was used to assess migration. A) &C) A549 cells expressing Control or Nrf2 shRNA; B) & D) HepG2 cells stably expressing FLAG/luciferase or FLAG/Keap1.