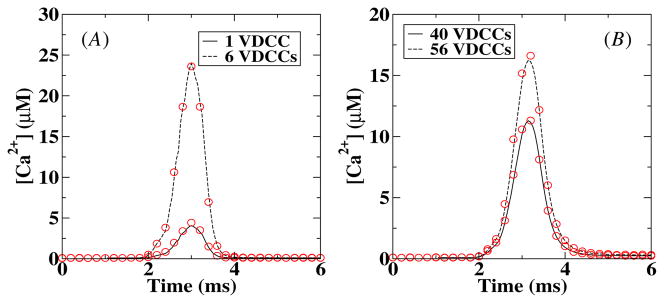
Figure 3.
Comparison between deterministic and stochastic local Ca2+ concentration at 50 nm (A) and 250 nm (B) from the center of the VDCC cluster and 10 nm from the membrane. The solid and dashed lines correspond to deterministic results while the symbols are the results of the stochastic (MCell) simulations. The stochastic [Ca2+] was obtained by averaging over 1000 runs.

