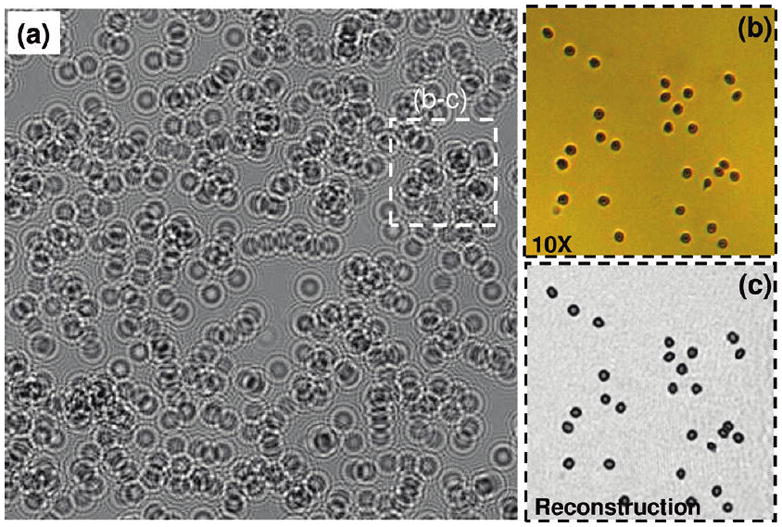
Figure 2.

Measured cell hologram amplitudes at an RBC concentration of 102 000 cells/μL, using the setup of Figure 1b; L = 10 cm, H = 0.7 mm, and D = 50 μm. In this case, cell shadow overlap probability on the chip is quite high for the raw holographic image of panel (a). The lens-free holographic image of panel (a) is digitally cropped from a much larger field of view of ~24 mm2. (b) Matching microscope image acquired with a 10× objective lens (NA = 0.2) showing RBCs. (c) For the same FOV of panel (b), digital holographic reconstruction results are illustrated, which match the microscope image very well.
