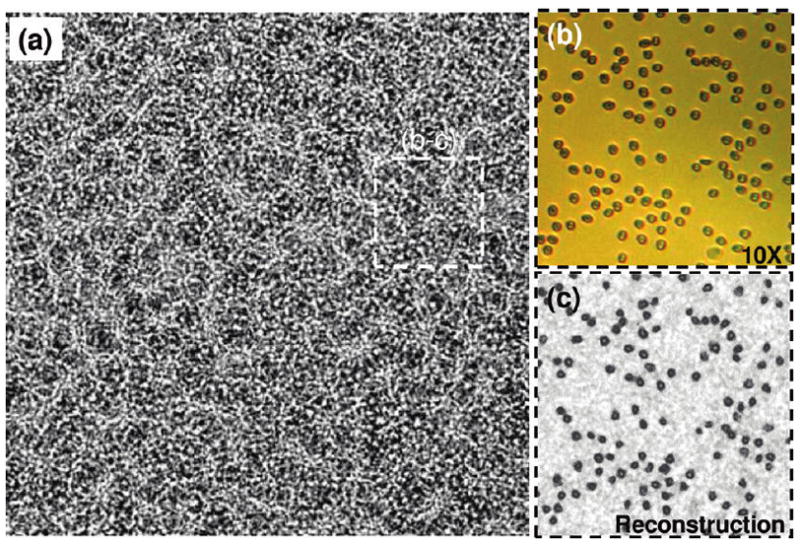
Figure 3.

Same as in Figure 2, except for an RBC concentration of ~394 000 cells/μL. At such high cell densities, the individual holographic signatures of the cells (as you would normally find in, e.g., Figure 2) get completely washed out by a noise-like speckle pattern, which fortunately still contains all the phase information of the cells. By digital recovery of this phase information, microscopic image of the cells on the chip can be recovered as illustrated in panel (c).
