Fig. 7.
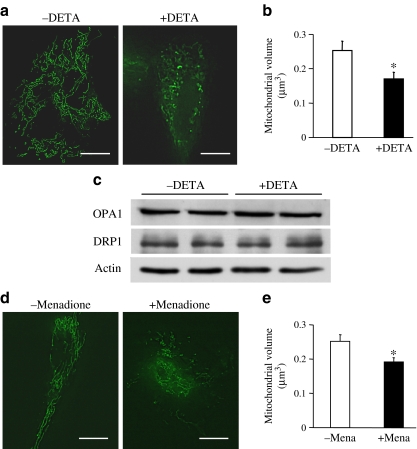
O2 − regulates mitochondrial morphology. Cells were incubated with compounds that generate O2 − in cytosol (10 μmol/l DETA), or in mitochondria (100 μmol/l menadione) for 1 h at room temperature and then stained with Mito Tracker Green to visualise mitochondrial morphology. a Representative images showing mitochondrial morphology in HCECs with or without DETA. Bar = 5 μm. b Summarised data for mitochondrial volume (μm3) in ECs. Data are mean ± SEM, n = 6 cells in each group. * p < 0.05 vs without DETA (−DETA). c Western blot showing OPA1, DRP1 and actin protein levels in HCECs with or without DETA. d Representative images showing mitochondrial morphology in HCECs with or without menadione. Scale bar, 5 μm. e Summarised data of mitochondrial volume (μm3) in ECs without menadione (−mena, n = 12 cells) and with menadione (+mena, n=6 cells). Data are mean ± SEM. *p < 0.05 vs without menadione. Excess O2 − generation in cytosol or mitochondria significantly increased mitochondrial fragmentation without changing OPA1 and DRP1 protein levels

