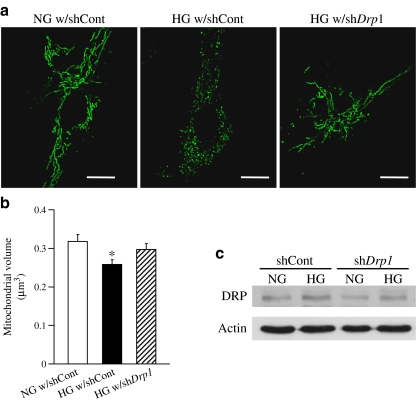
Fig. 8.
Downregulation of DRP1 protein level decreases high-glucose-treatment-induced mitochondrial fragmentation in HCECs. Drp1–shRNA (shDrp1) or control–shRNA (shCont) plasmids (1 μg) were transfected into HCECs by electroporation. Two days after the transfection, cells were treated with high glucose (25 mmol/l) or normal glucose (5 mmol/l glucose + 20 mmol/l mannitol) for 24 h. a Representative images showing mitochondrial morphology in ECs with control–shRNA in NG (NG w/shCont), with control–shRNA in HG (HG w/shCont), and with Drp1–shRNA in HG (HG w/shDrp1). Scale bar, 5 μm. b Summarised data for mitochondrial volume (μm3). Data are mean ± SEM, n = 8 cells in each group. *p < 0.05 vs NG w/shCont. c Western blot showing DRP1 and actin protein levels on day 3 after Drp1 or control shRNA transfection. Drp1–shRNA transfection successfully decreased DRP1 protein concentration

