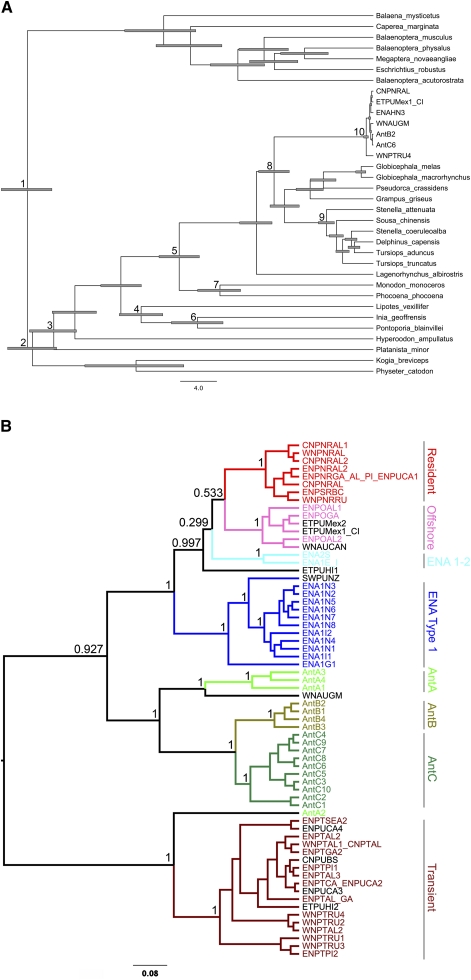
Figure 2.
(A) Bayesian phylogenetic tree of cetacean phylogeny of whole mitochondrial genomes from the public databases and new species from this study, including 95% highest posterior density interval (HPDI) bars. Nodes with divergence priors are indicated by numbers corresponding to taxonomic groups described in Supplemental Table S5. (B) Whole mitochondrial genome phylogeny of 66 unique killer whale haplotypes. Posterior probabilities are indicated for nodes of interest. Whales of known type are indicated in color, and those of unknown type are in black type.

