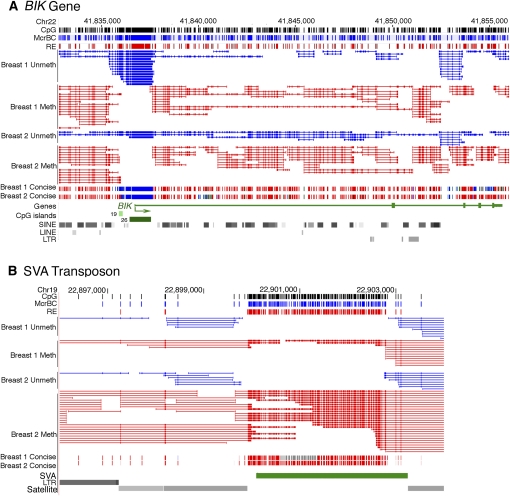
Figure 1.
High-resolution genome-wide methylation profiling and genome-wide DNA methylation trends. (A) Browser view of Methyl-MAPS data from the genomic region spanning the BIK gene. Individual mapped sequence reads are shown in the top raw data tracks. Red sequences were resistant to methylation-sensitive restriction endonucleases (RE) and are therefore methylated. Blue sequences were resistant to the methylation-dependent McrBC complex and are unmethylated. Tick marks in both tracks along the top of the figure and within each sequence indicate locations of individual RE and McrBC recognition sequences. Methylation data is also presented in a concise view, where each CpG is assigned a methylation score from the ratio of methylated to total (unmethylated and methylated) sequences covering each CpG site. The bulk of the BIK gene is methylated, while the CpG-rich promoter is unmethylated. (B) Methylation of the SVA retrotransposon in a repeat-rich region of chr 19. While the CpG density is comparable to that of the CpG island of the BIK gene shown in A, the SVA retrotransposon is densely methylated.

