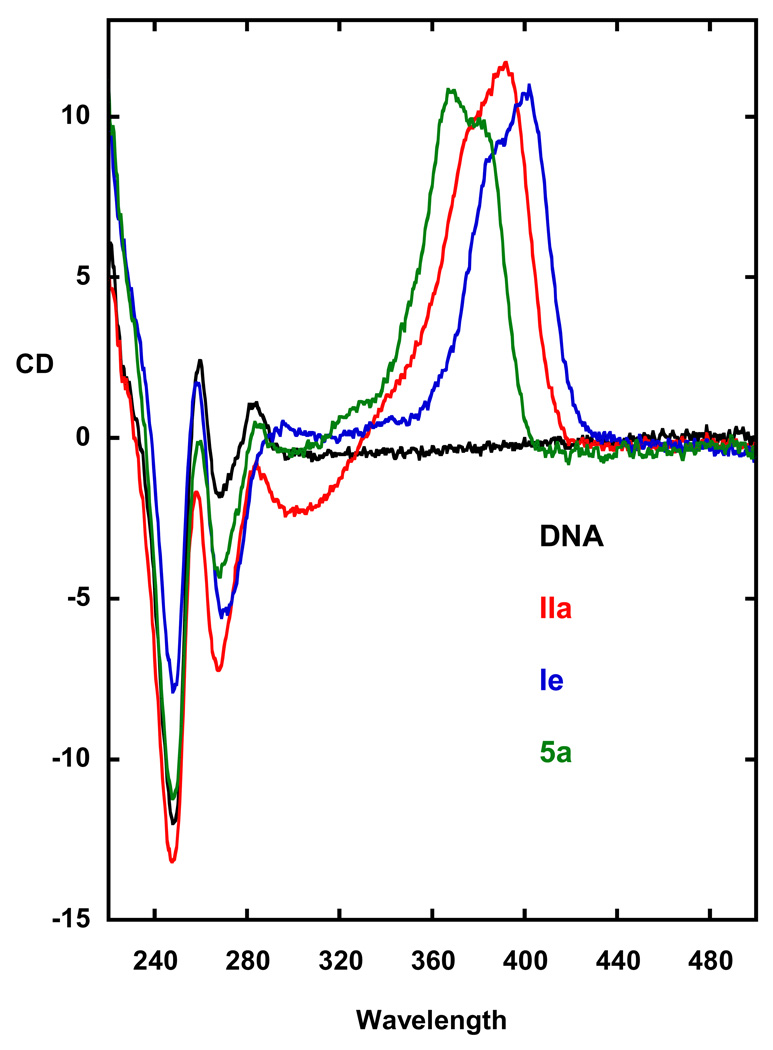
Figure 3.
Circular dichroism plots (CD versus wavelength) are shown for poly dA•dT (DNA) and its complexes with IIa, IIe and 5a. DNA without bound compond does not have any CD signal above 300 nm while the unbound compounds are not chiral. On binding to DNA the compounds exhibit a large positive CD spectrum above 300nm hat is characteristic of minor groove binding. The changes below 300 are due to induced changes in the compound CD as well as slight changes in the DNA spectrum.

