
Fig. 1.
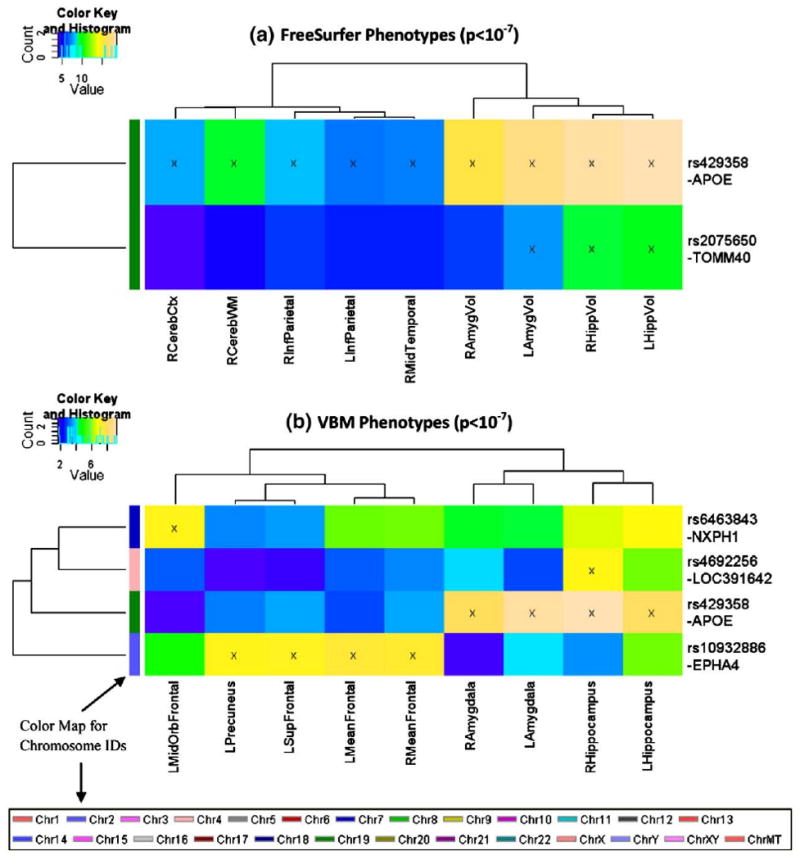
Heat maps of SNP associations with quantitative traits (QTs) at the significance level of p<10−7. GWAS results at a statistical threshold of p<10−7 using QTs derived from FreeSurfer (top) and VBM/MarSBaR (bottom) are shown. −log10(p-values) from each GWAS are color-mapped and displayed in the heat maps. Heat map blocks labeled with “x” reach the significance level of p<10−7. Only top SNPs and QTs are included in the heat maps, and so each row (SNP) and column (QT) has at least one “x” block. Dendrograms derived from hierarchical clustering are plotted for both SNPs and QTs. The color bar on the left side of the heat map codes the chromosome IDs for the corresponding SNPs. (For interpretation of the references to colour in this figure legend, the reader is referred to the web version of this article.)