
Fig. 5.
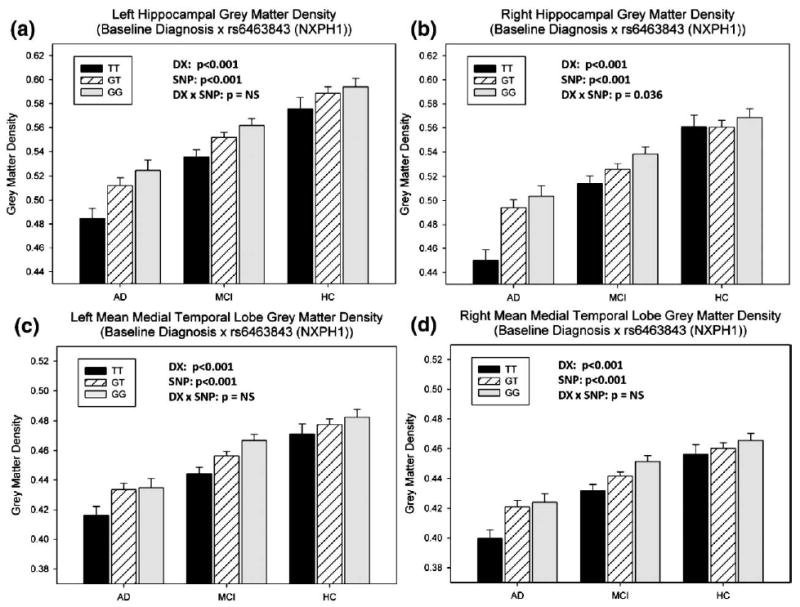
Refined analysis of sample imaging phenotypes in relation to rs6463843 (NXPH1) and baseline diagnosis. Two-way ANOVAs were applied to examine the effects of rs6463843 (NXPH1) and baseline diagnosis on four target GM density measures: (a–b) left and right hippocampal GMDs, and (c–d) left and right mean medial temporal lobe GMDs. All the analyses included age, gender, education, handedness and baseline ICV as covariates. n=715 subjects were involved: 166 AD (44 TT, 78 GT, 44 GG); 346 MCI (82 TT, 170 GT, 94 GG); 203 HC (35 TT, 105 GT, 63 GG). The p-values for the main effect of diagnosis (DX), the main effect of SNP (SNP), and the interaction effect of SNP-by-diagnosis (DX×SNP) were shown in each plot.