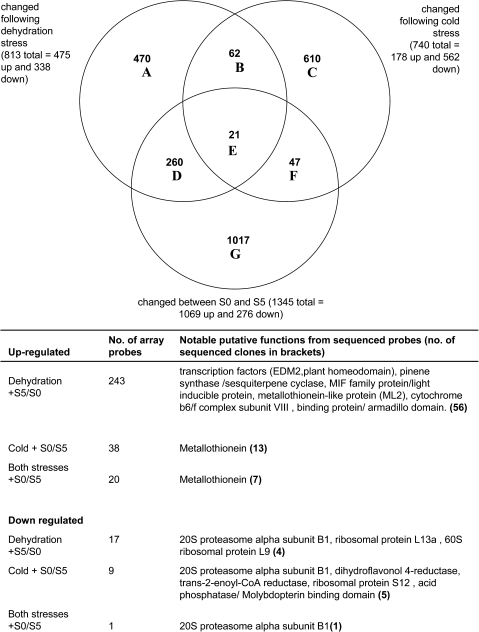
Fig. 5.
Venn diagram and details of microarray probes whose signal changed following cold stress (3 d cold treatment followed by a 3 h or 24 h refreshment period) or ambient dehydration stress (6 h or 24 h followed by a 3 h refreshment period) compared with developmental changes between stage S0 and stage S5 (stage S0 petals were from closed buds and stage S5 represents the first visible signs of senescence). The two subtreatments associated with each stress were grouped together. Details of main gene functions associated with some of the Venn diagram intersections are listed below the diagram.

