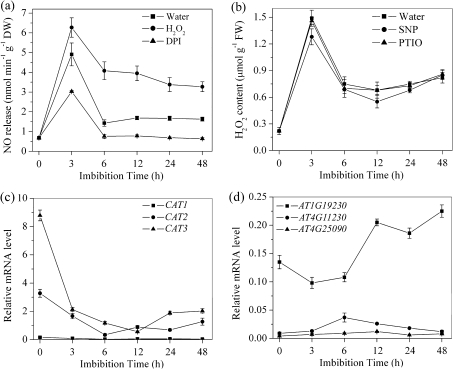
Fig. 4.
Effect of H2O2 and NO on each other's production and the transcription of CAT and NADPH genes during imbibition. (a) Changes in NO release during imbibition with water, H2O2 (10 mM), and its production inhibitor DPI (10 μM). (b) Changes in H2O2 release during imbibition with water, SNP (200 μM), and its scavenger c-PTIO (200 μM). (c) The transcript levels of CAT H2O2 catabolism genes during imbibition. (d). The transcript levels of H2O2 NADPH production genes during imbibition. Values are means±SE (n=4 for a and b, and n=3 for c and d). An ANOVA test followed by a rank test was performed. Different letters are used to indicate means that are significantly different (P <0.05).

