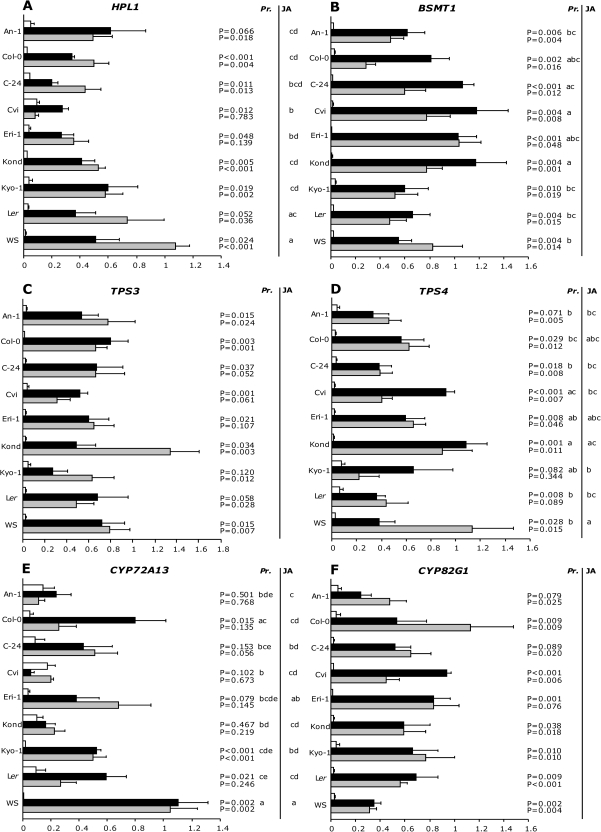
Fig. 5.
Expression changes of six Arabidopsis thaliana genes in untreated (white bars), Pieris rapae infested (black bars) or JA-treated (grey bars) plants of nine Arabidopsis thaliana accessions. Bars represent relative expression levels (2–δCt), calculated from four biological replicates (mean +SE). Note that scales on the x-axes are not identical. Behind bars that represent P. rapae and JA-induced transcript levels of genes, P values are given for the induction. Letters represent groups of accessions that did not significantly differ after ANOVA followed by post-hoc analysis, given for each treatment separately.

