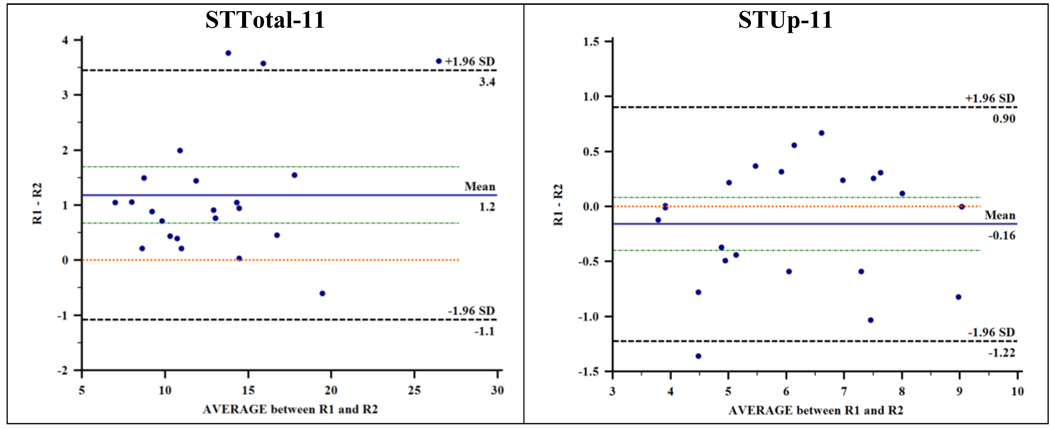
Figure 1.
Bland and Altman plots of the differences (vertical axes) versus means (horizontal axes) of rater 1 (R1) and rater 2 (R2) scores during 11-step stair ascend/descend test (STTotal-11) and stair up (ascend) test (STUp-11). NOTE. Solid lines represent the mean difference between raters. Lines with small dashes just above and below the mean difference represent the 95% CI of the mean difference. The lines over 0 (zero) are the lines of equality.

