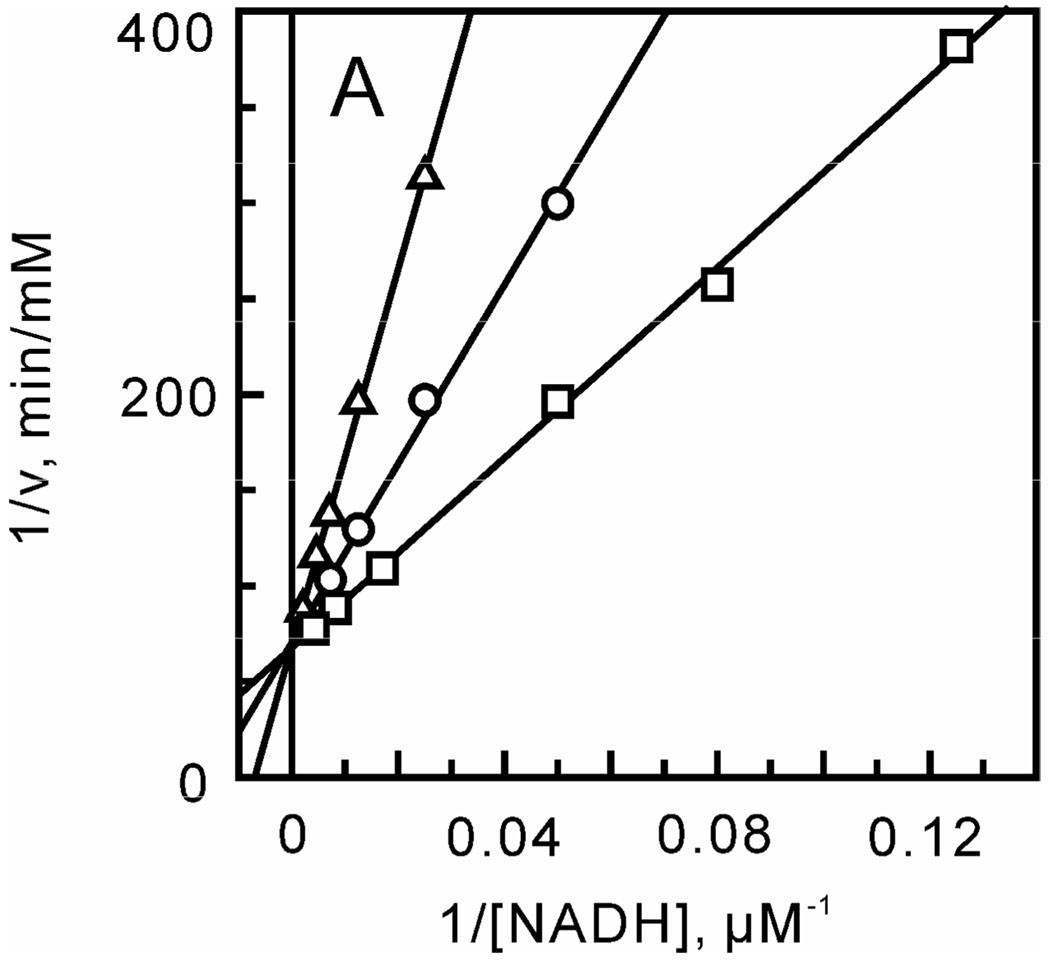
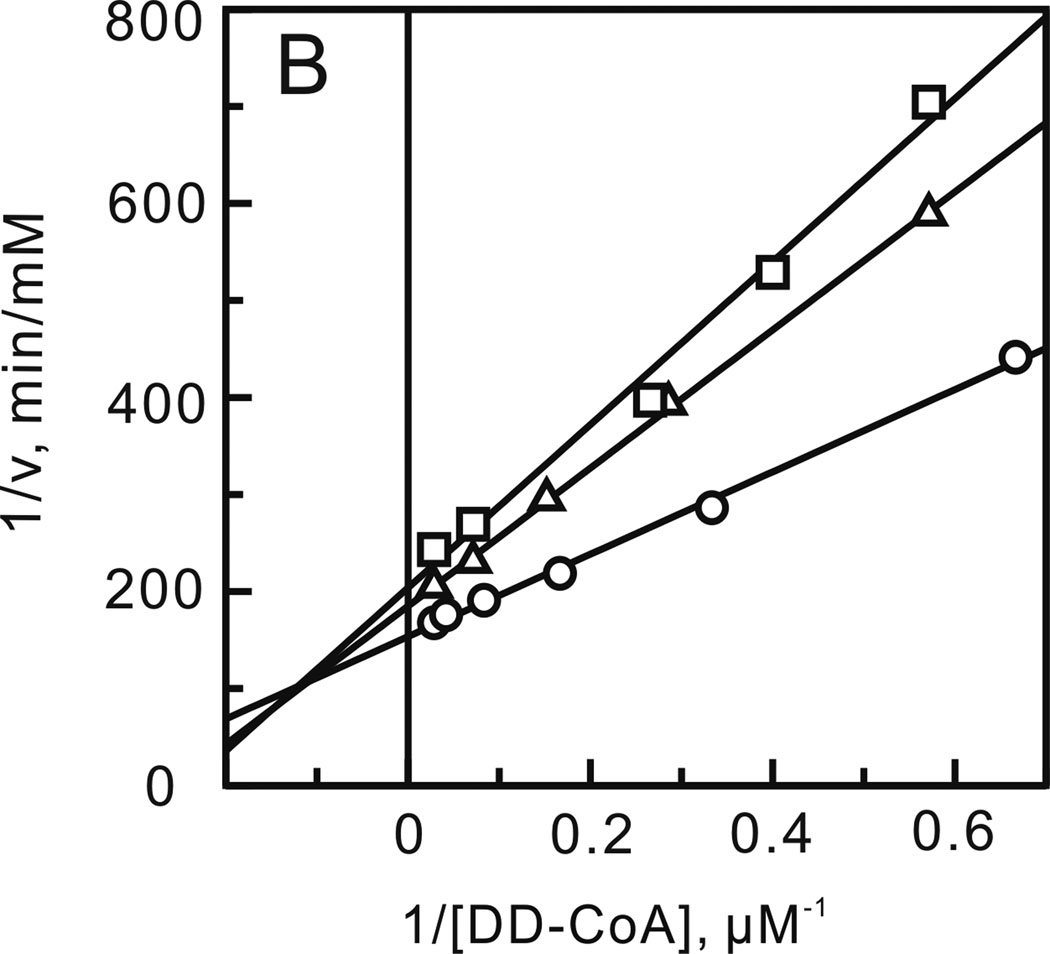
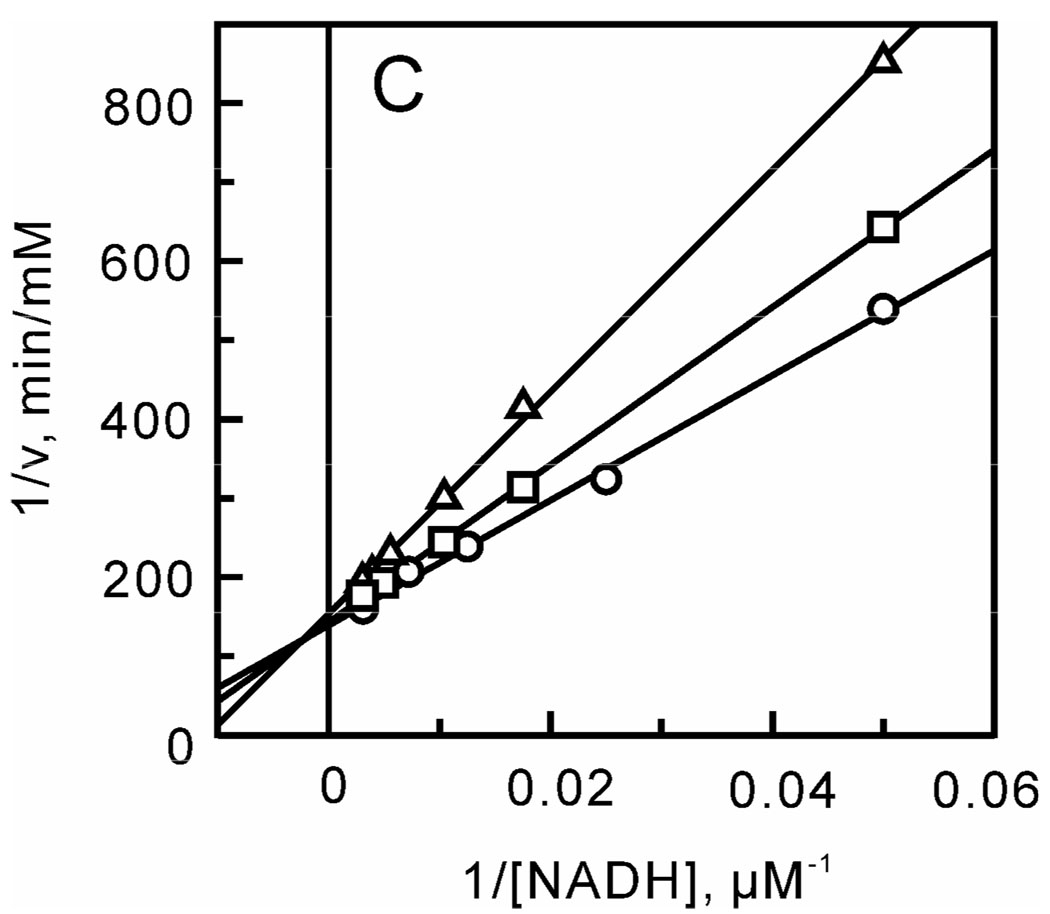
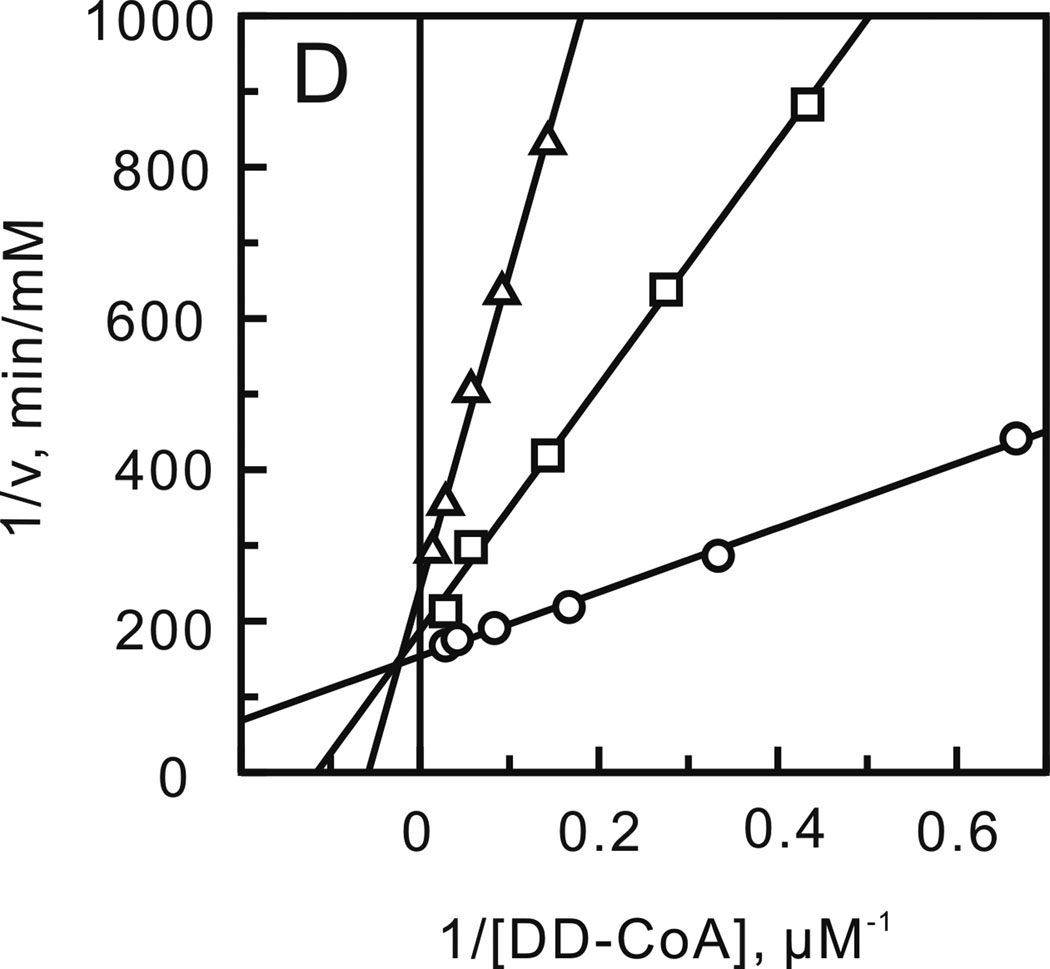
FIGURE 2.
Product inhibition studies to determine the substrate binding order. Assays were performed by varying the concentration of one substrate at a fixed concentration of the second substrate and in the presence of one of the products of the reaction. (A) NADH varied in the presence of NAD+ (0 (□), 55 (○) and 110 µM (Δ)) with DD-CoA fixed at 35 µM. (B) DD-CoA varied in the presence of NAD+ (0 (○), 55 (Δ) and 110 µM (□)) with NADH fixed at 250 µM. (C) NADH varied in the presence of lauryl-CoA (0 (○), 50 (□) and 100 µM (Δ)) with DD-CoA fixed at 35 µM. (D) DD-CoA varied in the presence of lauryl-CoA (0 (○), 50 (□) and 100 µM (Δ)) with NADH fixed at 250 µM.


