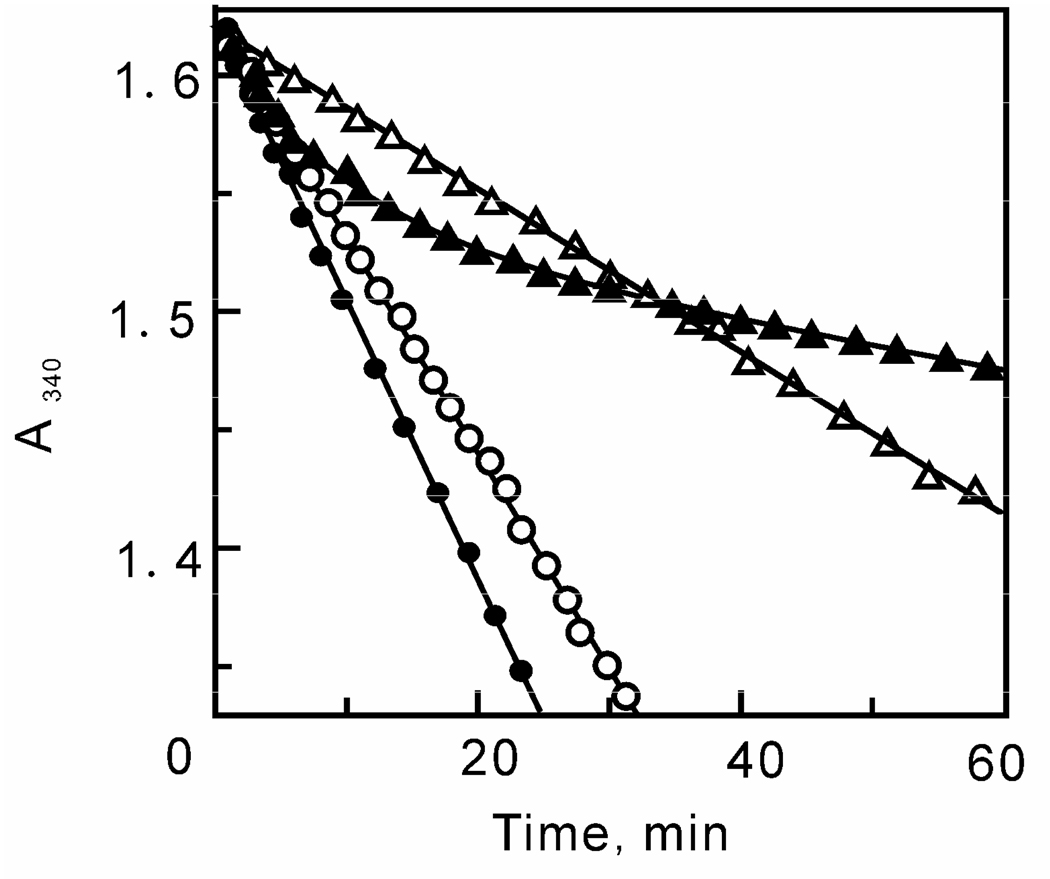
FIGURE 5.
Progress curve analysis of ftuFabI and bmFabV. Progress curves for ftuFabI (2 nM) in the presence of DD-CoA (200 µM), NADH (250 µM) and either 0 (●) or 60 nM (▲) triclosan. Progress curves for bmFabV (2 nM) in the presence of DD-CoA (200 µM), NADH (250 µM) and either 0 (○) or 2 µM (∆) triclosan.

