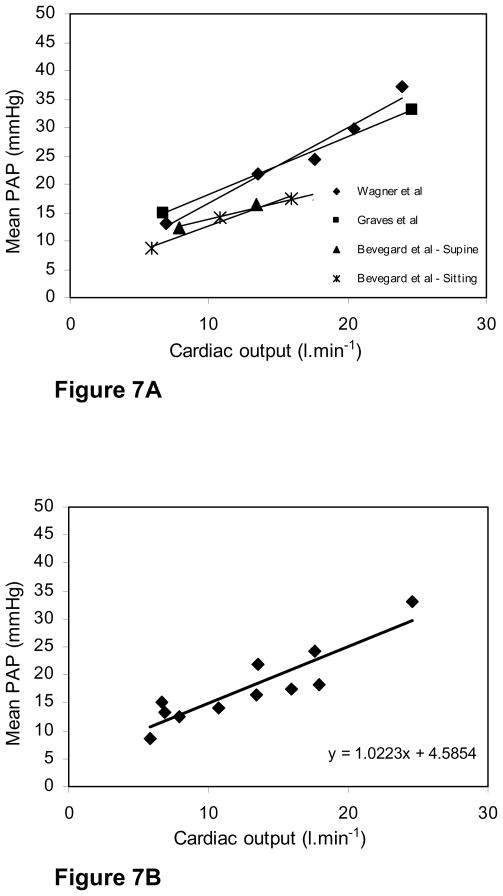
Fig. 7. Fig. 7A. Increases in mean pulmonary artery pressure with oxygen consumption during exercise in three human studies (15–17).
In two of these, high levels of exercise were obtained, while in the third, measurements were made of subjects in both the sitting and supine positions but the levels of exercise were lower.
Fig. 7B. Pooled data from the three human studies with the line of best fit (least squares) R2 = 0.81.

