
Fig. 6.
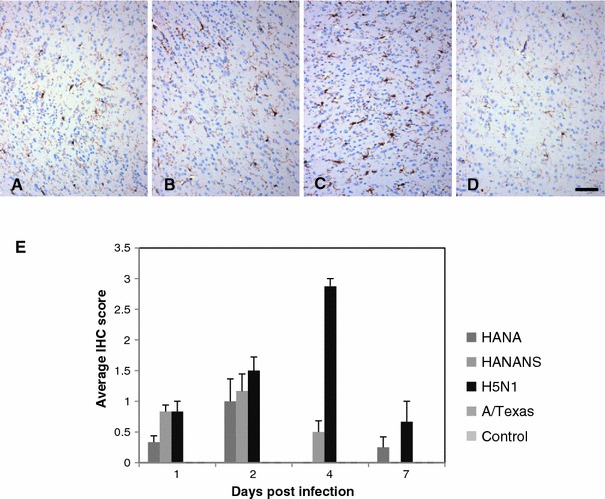
a–d Demonstration of microglial cells (Iba-1-positive) in the brain (examples are all from the same region of the occipital lobe) of cynomolgus macaques at day 4 pi after infection with influenza viruses. a An animal infected with HANA reassortant virus. b An animal infected with HANANS reassortant virus. c An animal infected with H5N1 virus. d An animal infected with A/Texas virus. Expression in the sham-infected control animals was indistinguishable from that of the A/Texas-group (not shown). a–d IHC, scale bar 640 μm. e Semi-quantitative scores for expression of the Iba-1 marker, judged on a scale of 0 (normal level of expression) to 6, taking into account both number of positive cells and intensity of labeling. Three sections, from the parietal, temporal and occipital cortex, were examined for each animal and averaged for each time point and group. Standard errors of the mean are shown