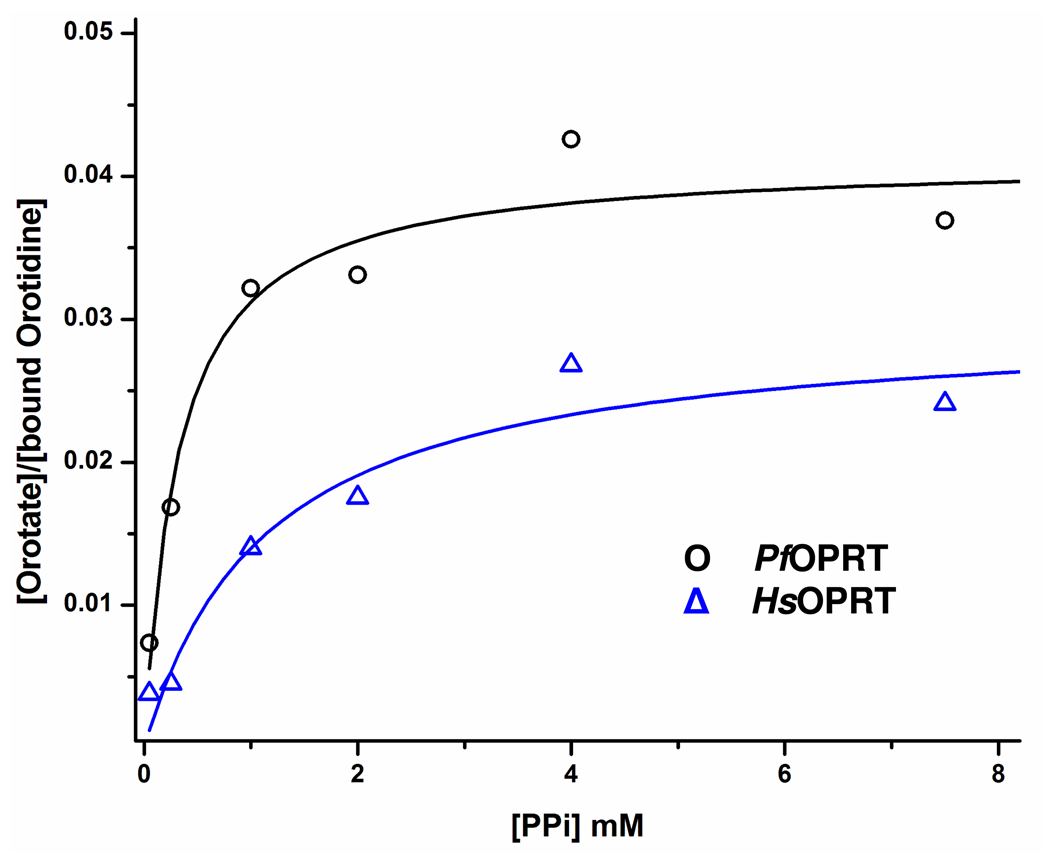
Figure 3.
Measurements of forward commitment factors of PfOPRT and HsOPRT. [1'-3H]Orotidine was pre-incubated with OPRTs. The mixture was diluted with a large excess of cold orotidine and various concentrations of PPi. The fractions of formed product from bound substrate were plotted versus the corresponding PPi concentrations. The forward commitment factors (Cf) were calculated from the equation
, where Ymax is the y axial intercept upon extrapolating the plateau region. The values of Cf are 0.043 ± 0.002 for PfOPRT ( ) and 0.031 ± 0.004 for HsOPRT (
 ).
).

