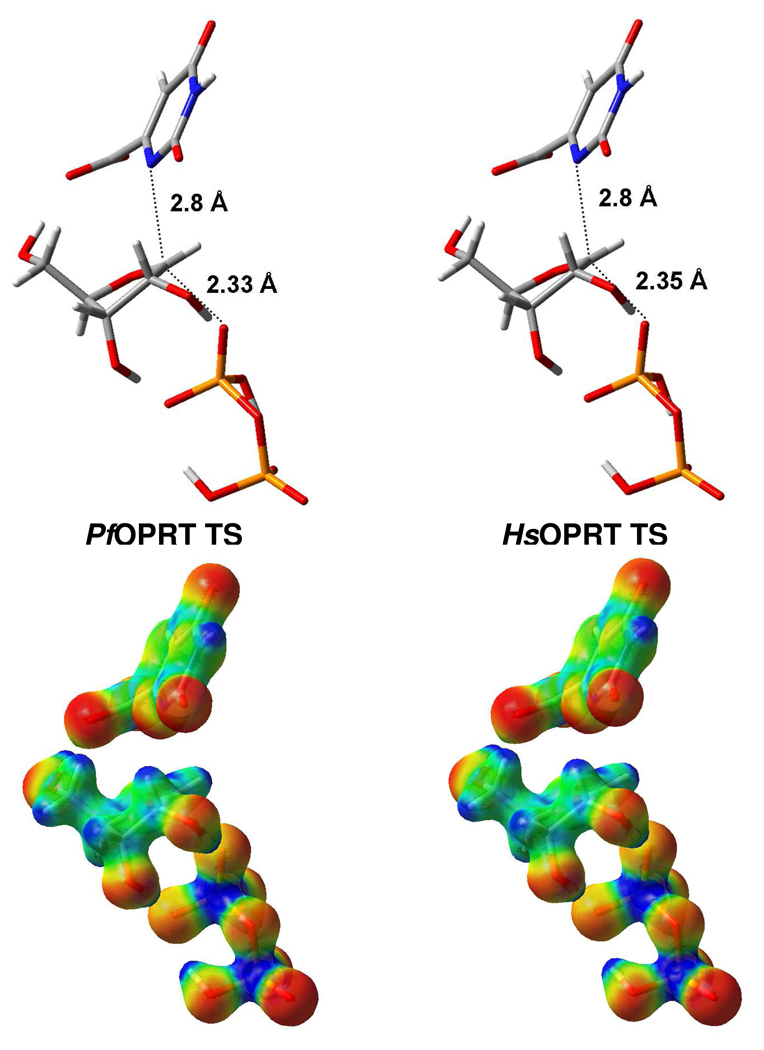
Figure 5.
Structures and molecular electrostatic potential (MEP) surfaces of PfOPRT and HsOPRT transition state. The distances of C1'–N1 and C1'–OPPi in the reaction coordinate are shown in the structures of PfOPRT and HsOPRT transition state. The transition state structures were calculated in vacuo using Gaussian 03 at the B3LYP/6-31G (d,p) level of theory. The MEP surfaces of PfOPRT and HsOPRT transition states were generated by CUBE subprogram from Gaussian 03 and visualized using GaussView 3.09 at an isovalue of 0.068. Electron rich and deficient are represented by red and blue, respectively.

