
Figure 2. The voltage-dependence of unitary L-type Ca2+ channel peak Po, recorded with 2 mM Ca2+.
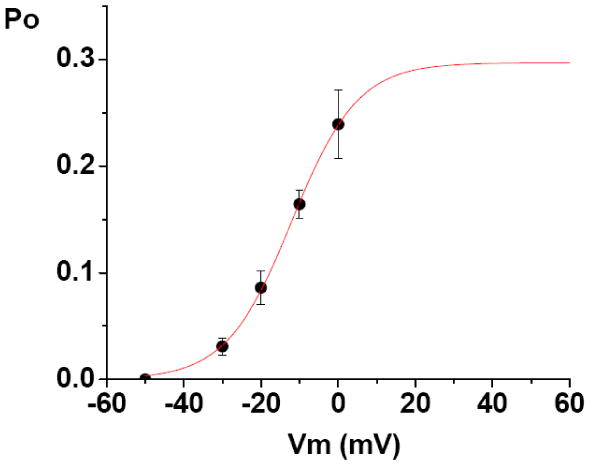
The data points are the averaged peak Po (+/- SE) at each test potential (n = 5 cells). The population means are significantly different at the p< 0.05 level. The Po vs. Vm data was best fit using a Boltzmann equation (red curve), with a maximum value of 0.29 +/- 0.014, midpoint of -12.0 +/- 1.07 mV, and a slope factor of 8.5 +/- 0.5. The Chiˆ2/ (degrees of freedom) of the fit was 0.00001, and the R2 value was 0.99945.