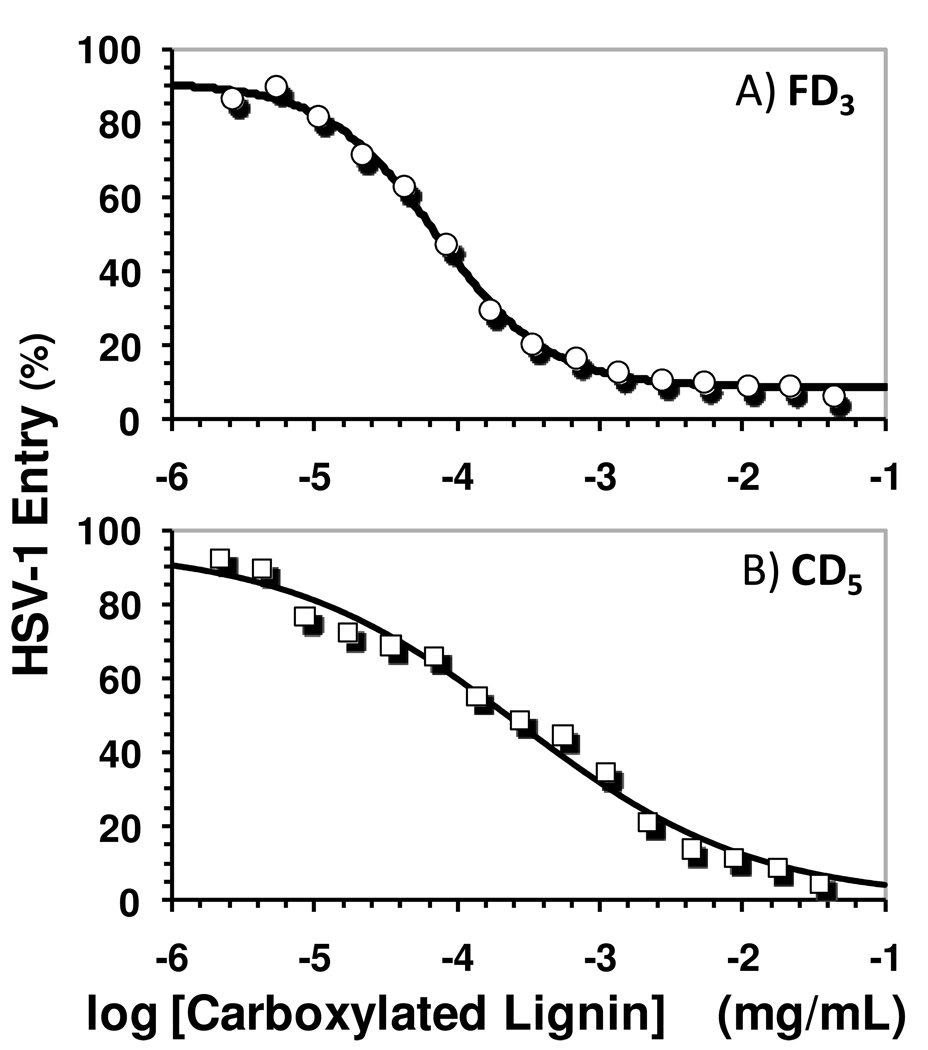
Figure 3.
Profile of HSV-1 entry into cells in the presence of FD3 (A) and CD5 (B) using a β-galactosidase activity-based viral entry assay. Profiles of other fractions were similar and not shown. IC50 values calculated from these profiles are listed in Table 2. See Methods for details.

